Posts Tagged ‘Television’
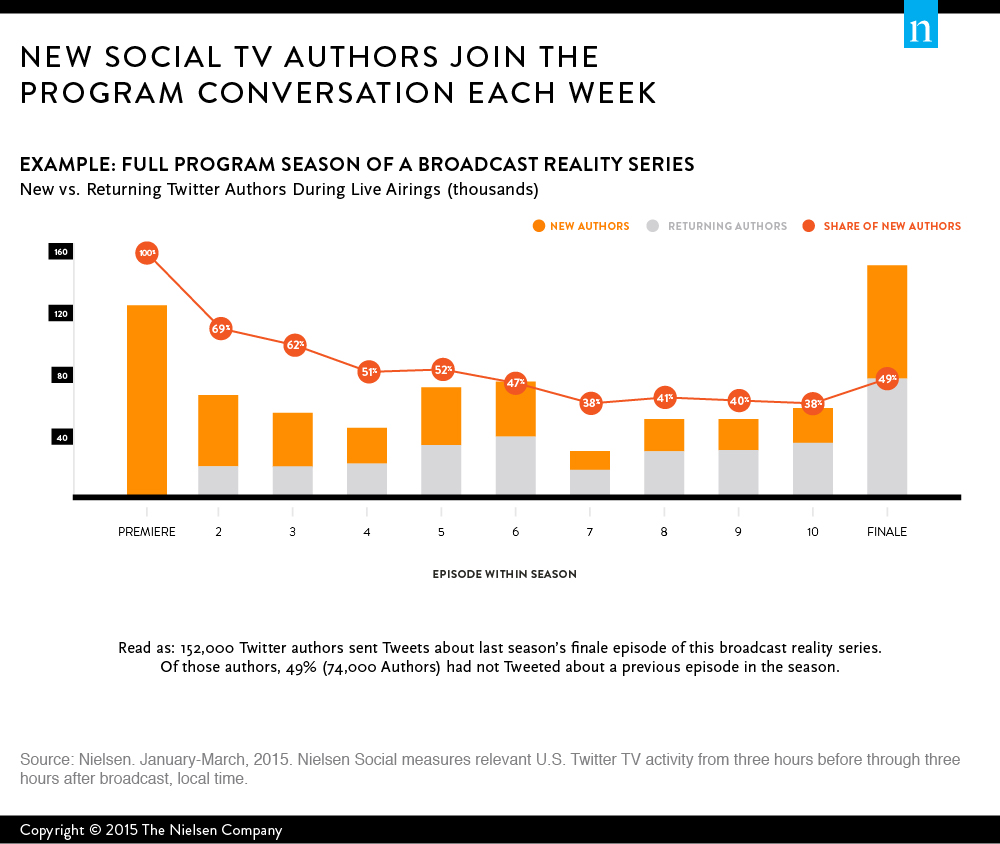
How Social TV Fans Join Program Conversations [CHART]
A Nielsen survey demonstrates how social TV fans join Twitter conversations about their favorite programs during the course of a season.
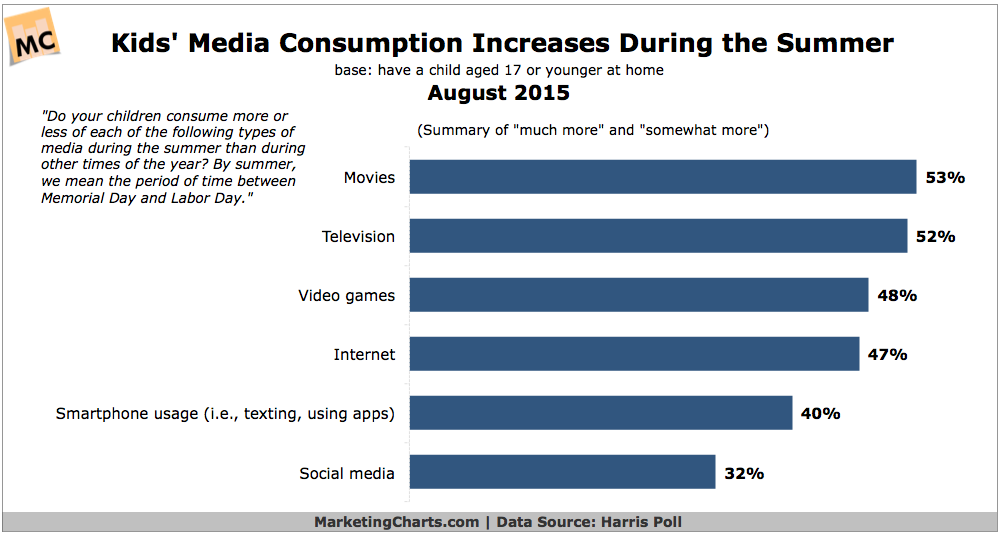
Read MoreKids' Summer Media Consumption, August 2015 [CHART]
Kids’ media consumption goes up during the summer, particularly when it comes to movies and TV.
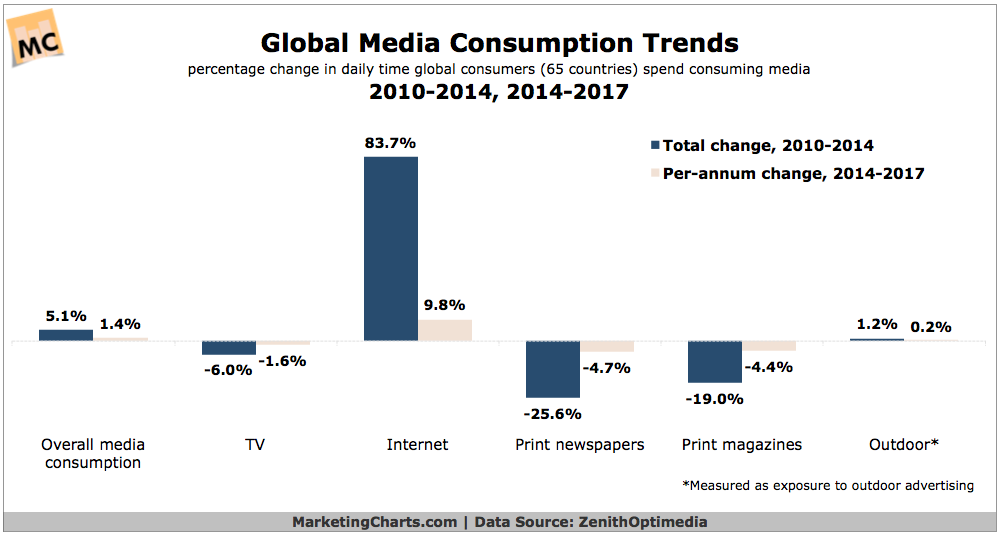
Read MoreGlobal Daily Media Consumption Time, 2010-2017 [CHART]
Global internet consumption grew by almost 84% between 2010 and 2014, driving overall media consumption growth of 5.1%, to 485 minutes per day,
Read MoreInternet-Connected TV Market Penetration & Viewing, 2010-2015 [CHART]
Some 56% of US households have at least one TV set connected to the internet through a video game system, smart TV set, Blu-ray player and/or streaming media device.
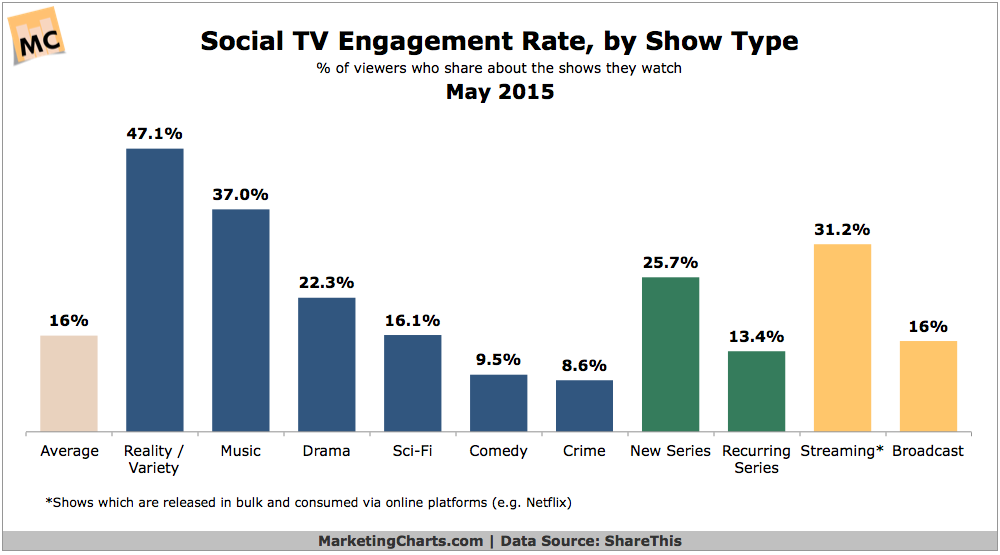
Read MoreSocial TV Engagement Rates By Show Type, May 2015 [CHART]
Some 16% of TV viewers on average share content about the shows they’re watching online, with these viewers driving an impressive 11% of all online sharing.
Read MoreDaily Time Spent With Video By Device, 2011-2015 [CHART]
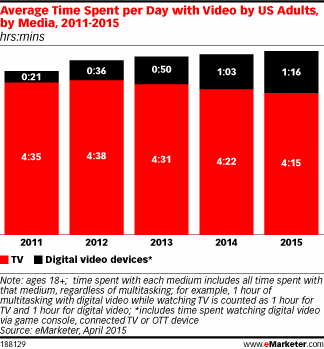
Adults in the US will spend an average of 5 hours, 31 minutes watching video each day this year.
Read MoreTV Multitasking By Generation, April 2015 [TABLE]
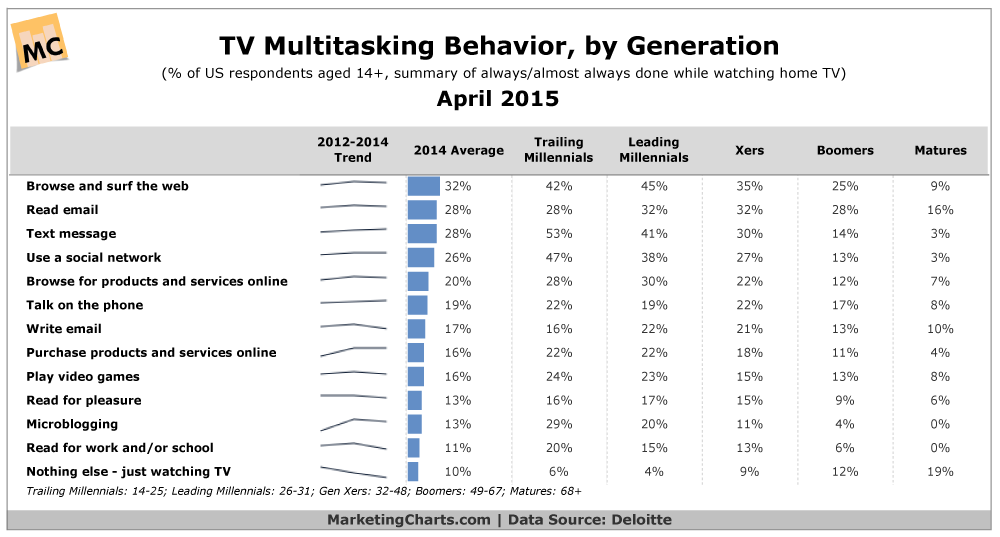
9 in 10 Americans age 14 and older claim to always or almost always multitask while watching TV, up from 81% a couple of years ago.
Read MoreUS Media Reach By Channel, March 2015 [CHART]
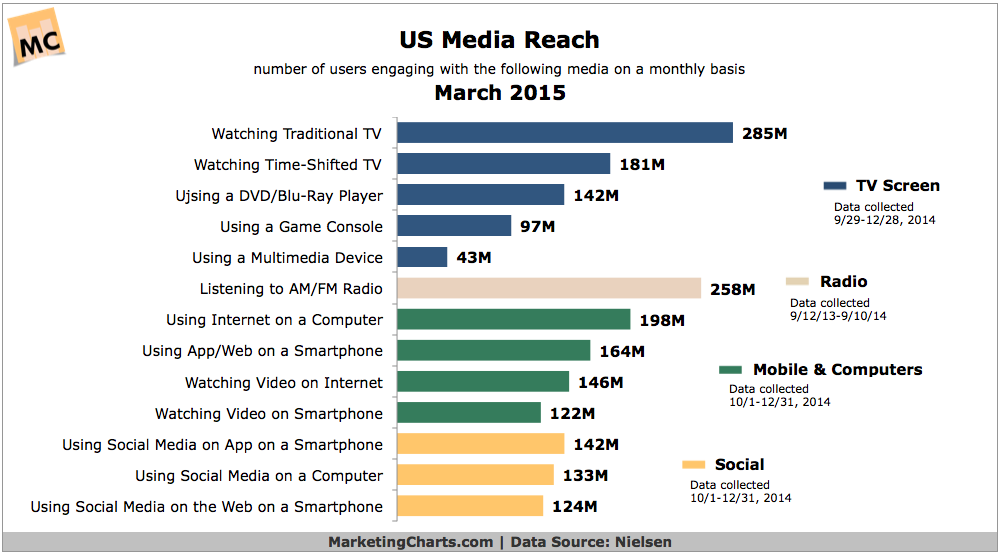
Some 142M Americans use social media applications on smartphones on a monthly basis, slightly higher than the number using social media on a computer 133 M.
Read MoreTraditional News Consumption Trends [INFOGRAPHIC]
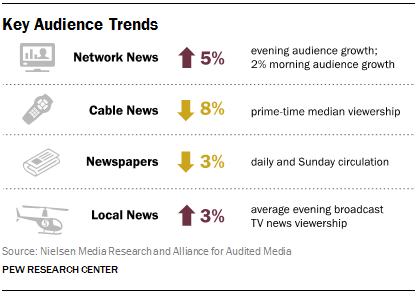
Even as mobile and social news habits evolve, legacy platforms have by no means been abandoned, though some are faring better than others.
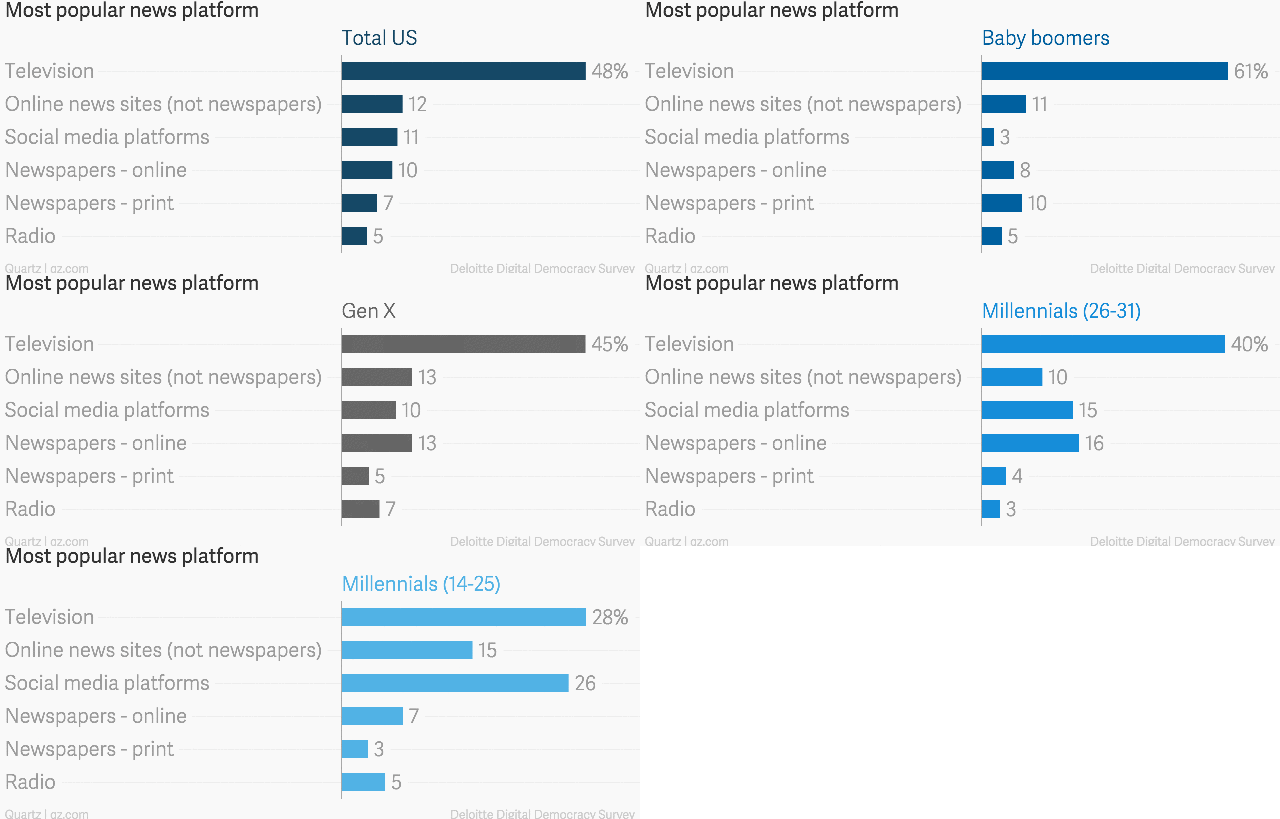
Read MoreMost Popular Sources Of News By Generation [CHART]
Most Popular Sources Of News: The younger you are, the more likely you’ll turn to social media for your news.
Read More