Posts Tagged ‘Television’
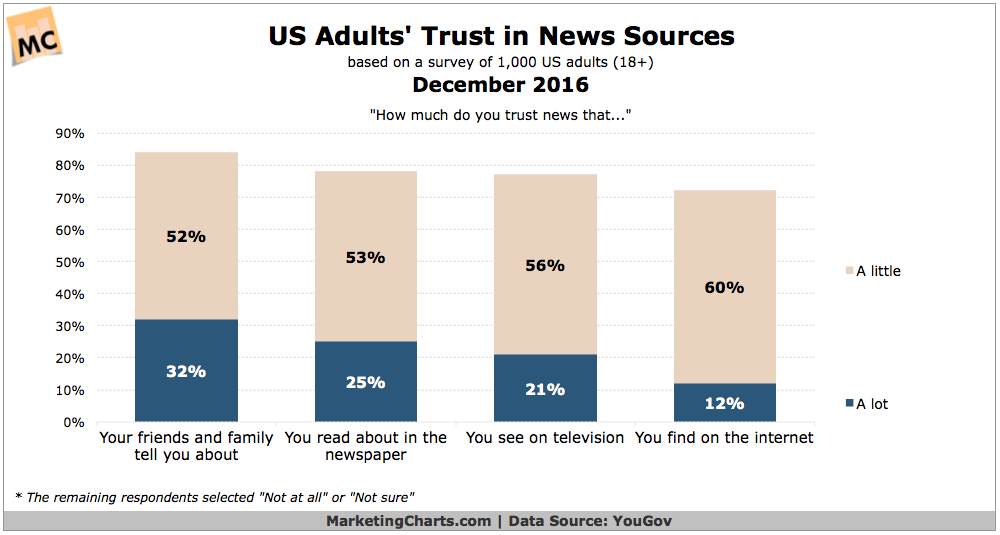
Consumer Trust In News Sources [CHART]
Americans are more likely to trust news that they read about in the ewspaper or see on TV than they are to trust what they read online.
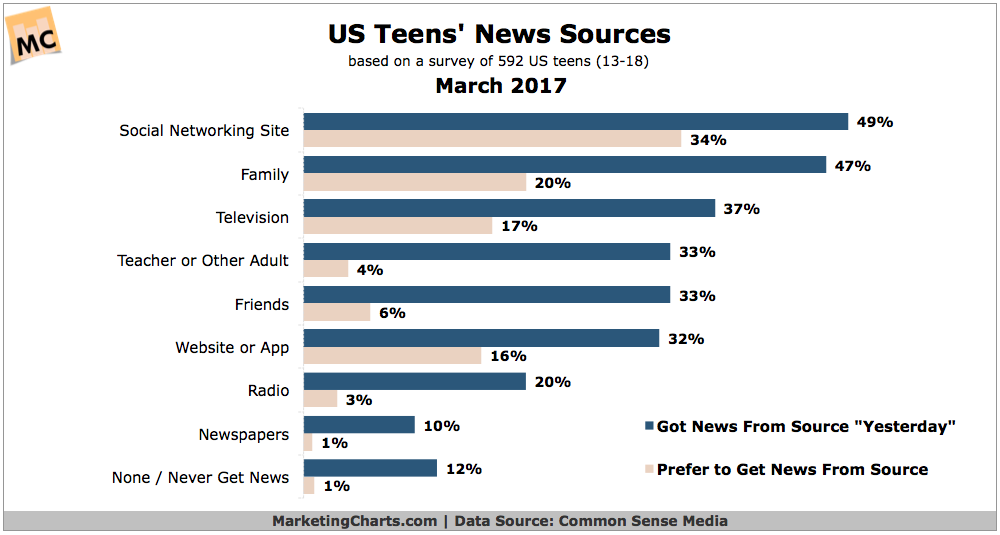
Read MoreTeens' News Media Sources [CHART]
More US teens say they get their news from social networking sites (49%) and family (47%) than from any other source.
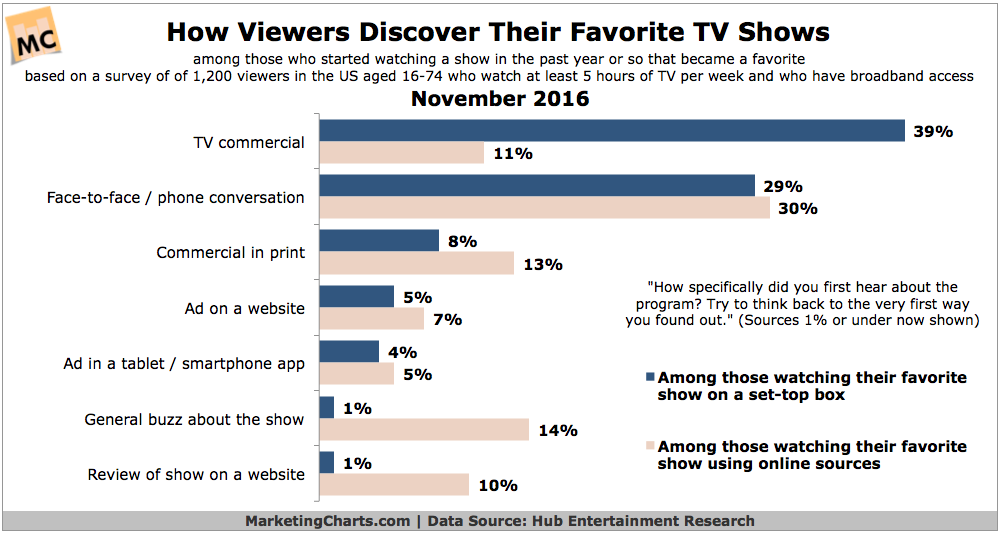
Read MoreHow People Find Their Favorite TV Shows
Live TV remains the single most common place to watch viewers’ new favorite shows, with 34% saying that’s their viewing source.
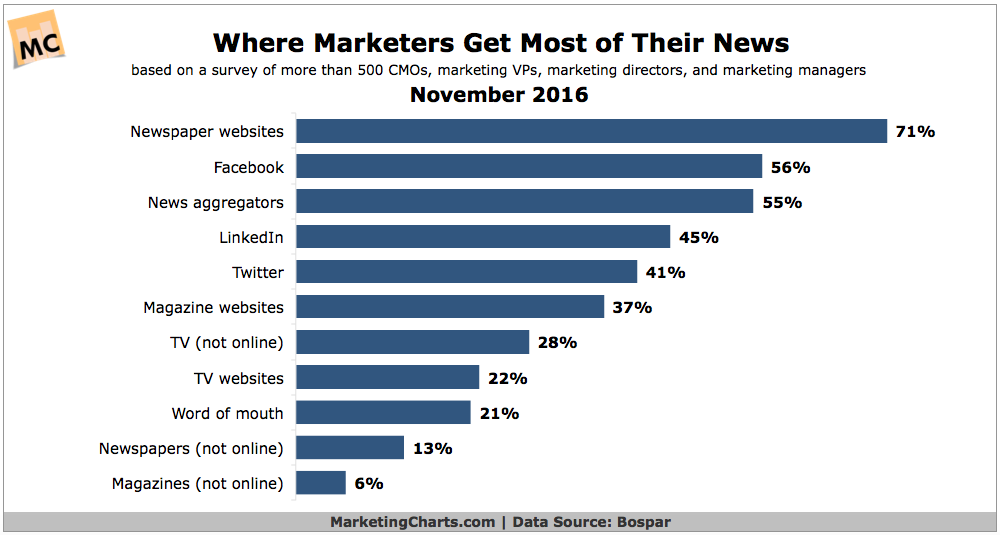
Read MoreWhere Marketers Get Their News [CHART]
Forget offline channels. Marketers are turning to online media to get their news, and that has implications for PR placements.
Read MoreNumber Of TV Channels Americans Watch [CHART]
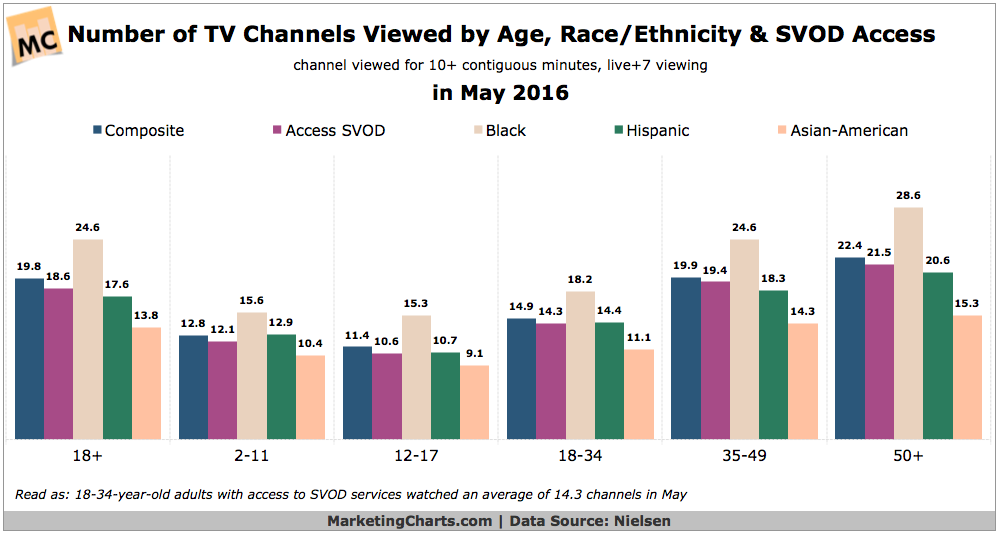
American adults received an average of 206 channels during the month of May, but watched less than 10% of those for roughly 20 channels viewed.
Read MoreAmerican Cultural Divide: 3 TV Shows' Popularity By Geography [MAPS]
The New York Times has analyzed Facebook data on the demographics of Americans who like 50 different television shows by way of illustrating America’s cultural divide.
Read MoreGlobal Online & TV Viewing, 2012-2017 [TABLE]
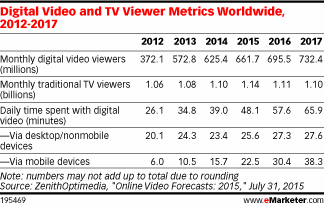
65% of internet users worldwide watched some type of video-on-demand, including both short-form and long-form content, in September 2015.
Read MoreAverage Time Per Day With Major Media [TABLE]
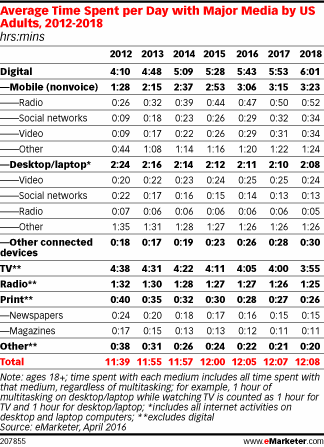
Younger consumers spend more time per week watching video on their desktop or laptop, as well as playing games via their console.
Read MoreMultiscreen Behavior [PODCAST]
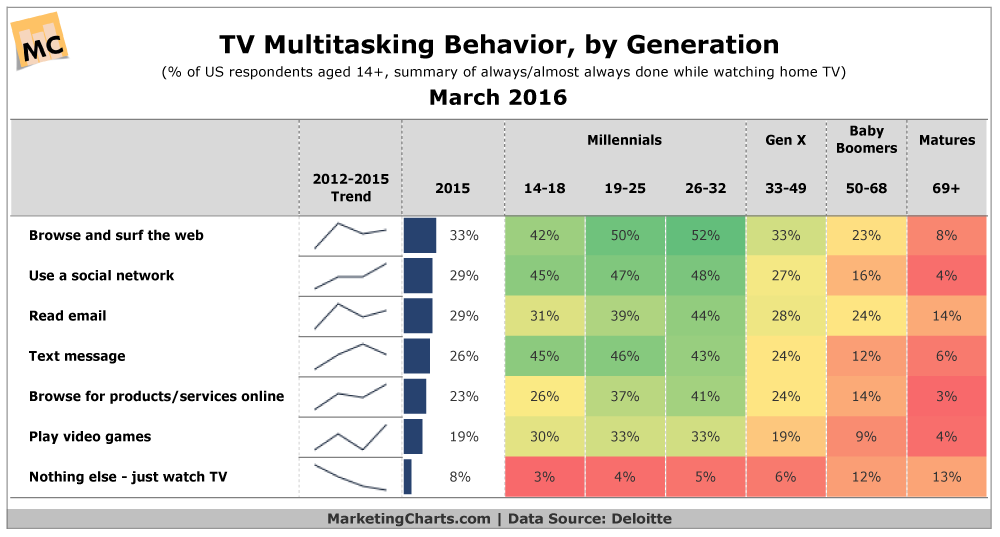
A podcast about multiscreen behavior and 10 charts about multitainment.
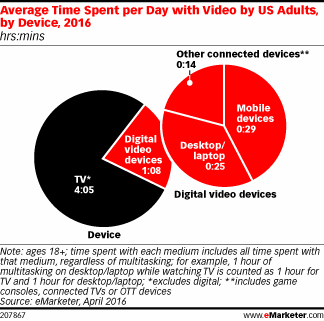
Read MoreAverage Daily Video Consumption By Device [CHART]
Even in a category as robust as digital video, though, growth has slowed and is expected to slow even more.
Read More