Posts Tagged ‘Television’
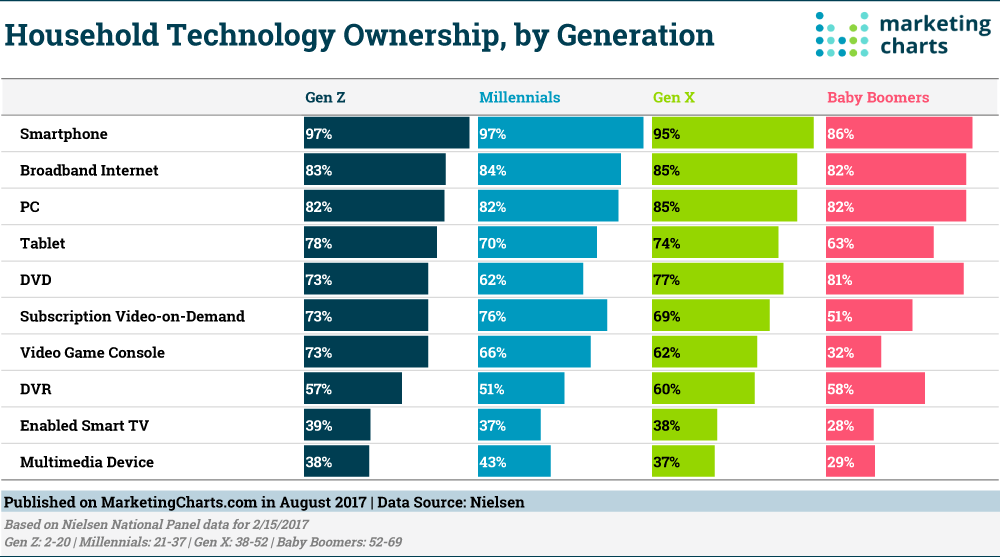
Household Technology By Generation [CHART]
Smartphones are almost omni-present in US households, reveals Nielsen in a recent report.
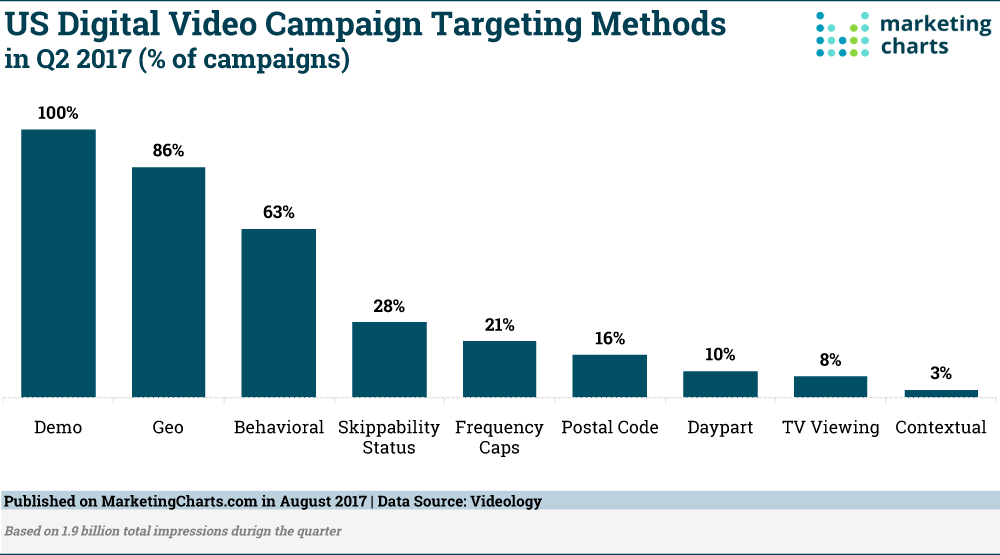
Read MoreVideo Advertising Targeting Methods [CHART]
Some 63% of US digital video campaigns on the Videology platform used behavioral targeting during the second quarter of this year.
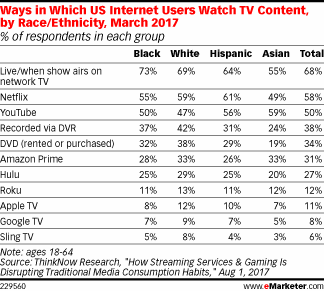
Read MoreHow People Watch TV By Ethnicity [TABLE]
Live TV remains the most popular method of watching TV programming overall in the US. However, new media channels are catching up with the traditional way of watching TV shows.
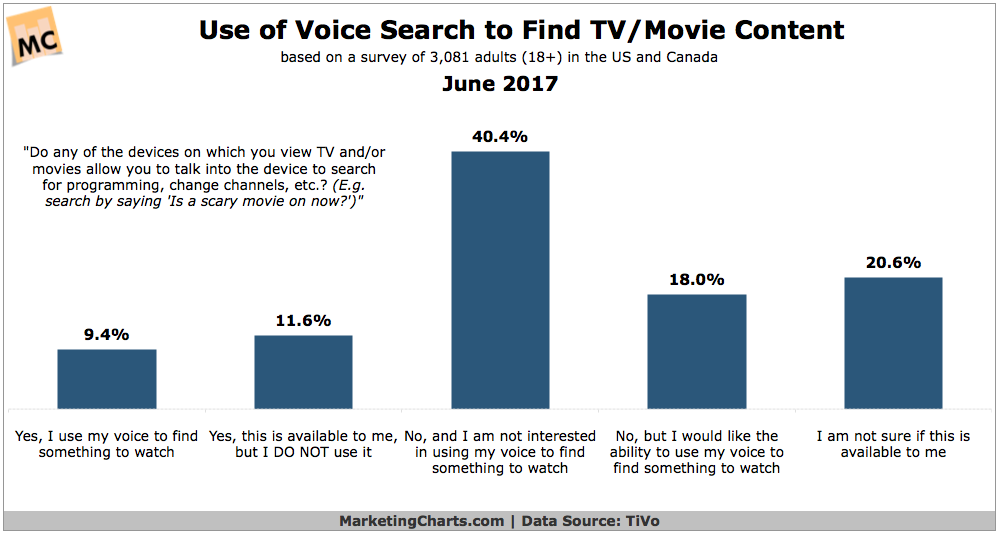
Read MoreUse Of Voice Search On TV [CHART]
Voice-enabled assistants are becoming more popular, and are beginning to be used for digital commerce. But what about voice and TV?
Read MoreUS Political Ad Spending Allocations, 2012 vs 2016 [CHART]
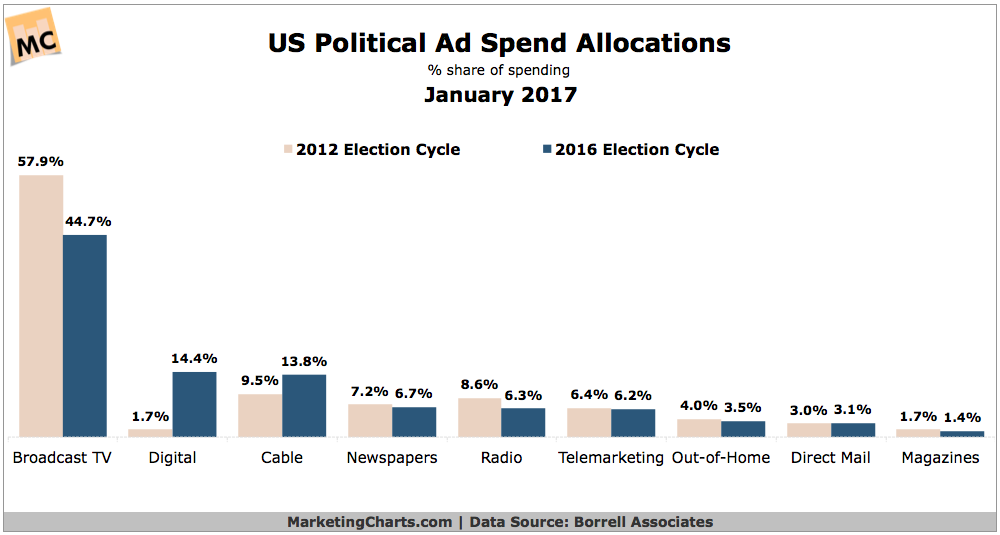
Political advertising reached $9.8 billion in the 2016 election year, marking a more than 4% increase from the 2012 election cycle ($9.4 billion) and representing a new record.
Read MoreTraditional TV Viewing, 2011-2016 [CHART]
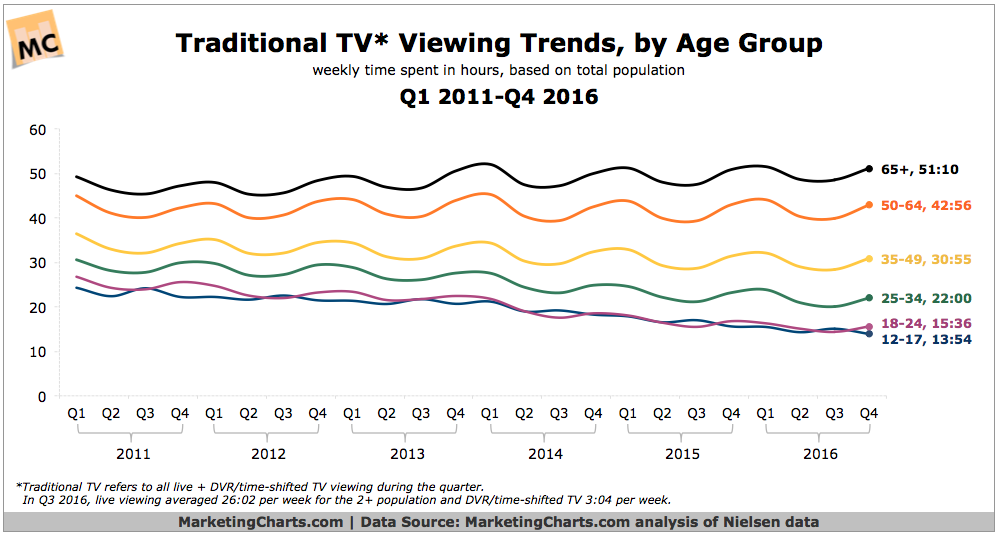
Between 2011 and 2016, Q4 traditional TV viewing by 18-24-year-olds dropped by almost 10 hours a week, or by roughly 1 hour and 25 minutes per day.
Read MoreTechnographics Of American Mothers [CHART]
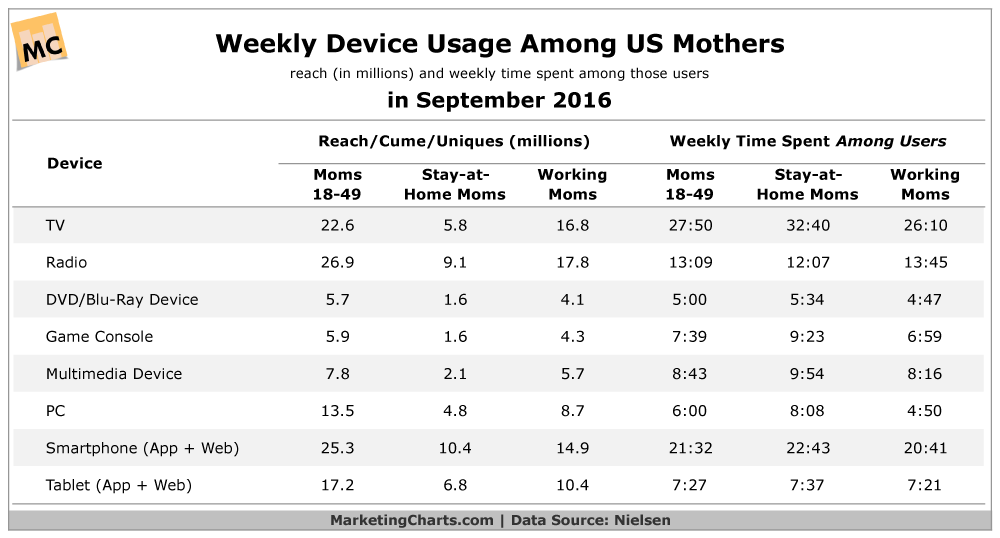
Across 10 technologies, ownership levels are universally greater among working than stay-at-home moms.
Read MoreTV Viewing Device Share [CHART]
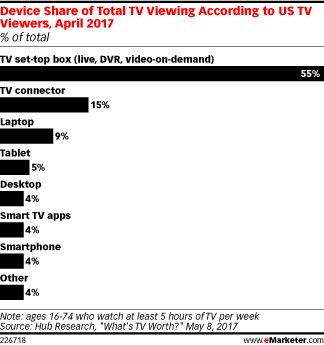
TV viewers have an abundance of devices at their disposal to watch content whenever and however they want. But in the US, the big screen is still their preferred access point.
Read MoreAverage Time Spent Per Day With Major Media [CHART]
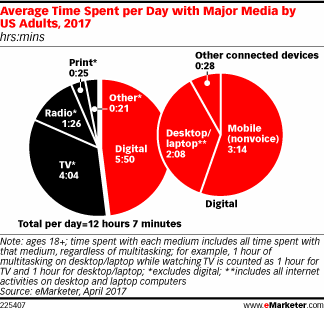
Thanks to multitasking, US adults’ average daily time spent with major media will slightly exceed 12 hours this year.
Read MoreDevices Through Which People Watch TV [CHART]
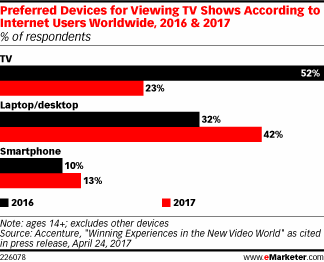
An Accenture survey of internet users around the world found a dramatic shift in TV viewing preferences, with computers abruptly displacing TVs as the preferred device for watching TV shows.
Read More