Posts Tagged ‘Television’
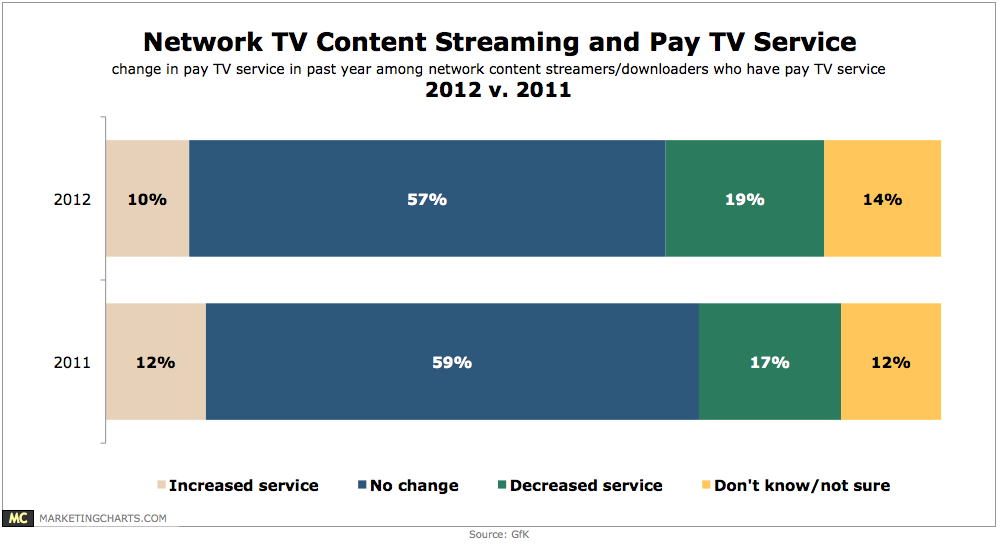
Network TV Streaming & Pay TV, 2011 vs 2012 [CHART]
19% of TV video streamers and downloaders in 2012 reported decreasing service (“cord-slicing”) in the past year.
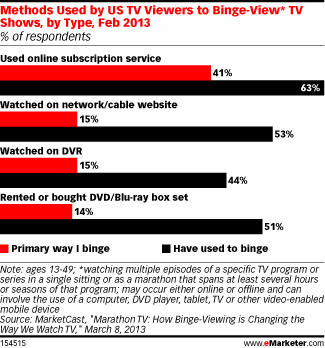
Read MoreHow People Binge On TV, February 2013 [CHART]
Most US TV viewers (63%) had used an online subscription service (like Netflix) to binge-view TV.
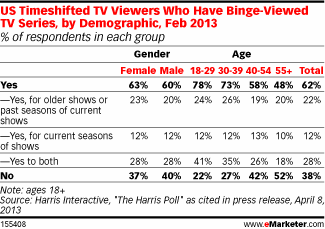
Read MoreBinge TV Viewing Behavior By Demographic, February 2013 [TABLE]
62% of people watched multiple episodes of a TV show in succession, also known as “binge-viewing.”
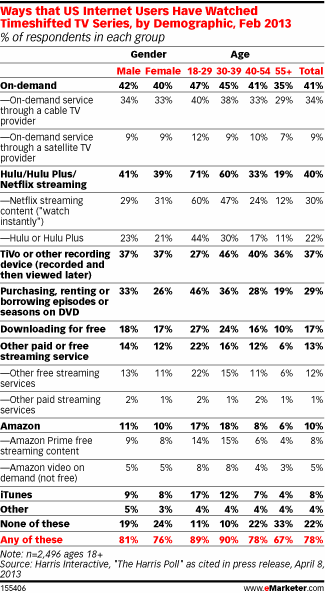
Read MoreHow People Watch Time-Shifted TV By Demographic, February 2013 [TABLE]
Nearly eight out of 10 US adult internet users watched TV on their own schedule.
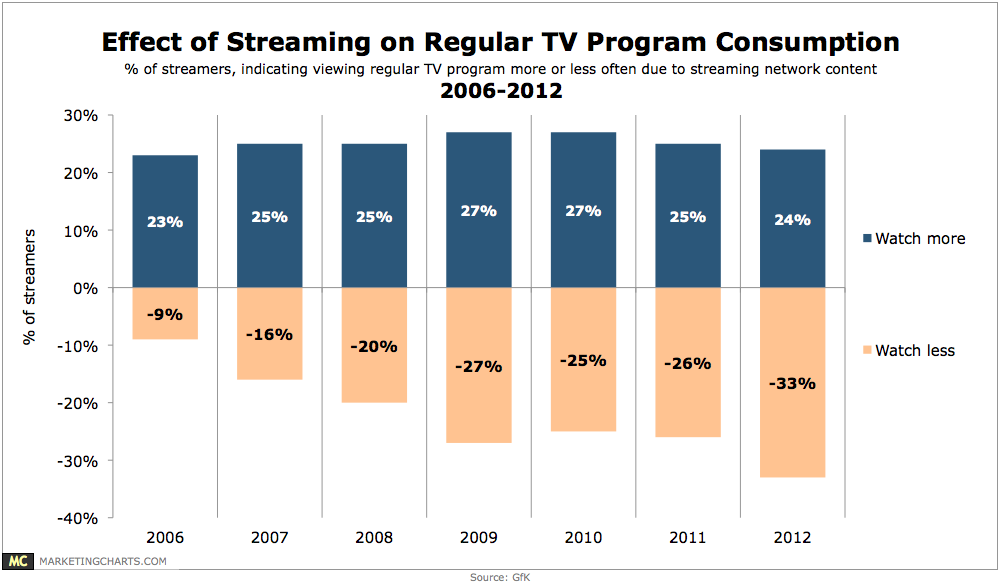
Read MoreEffect Of Streaming Video On Traditional TV Consumption, 2006-2012 [CHART]
34% of US internet users (and 30% of all consumers aged 13-54) surveyed in December 2012 reported having watched streaming video content that originated from a network since the beginning of September.
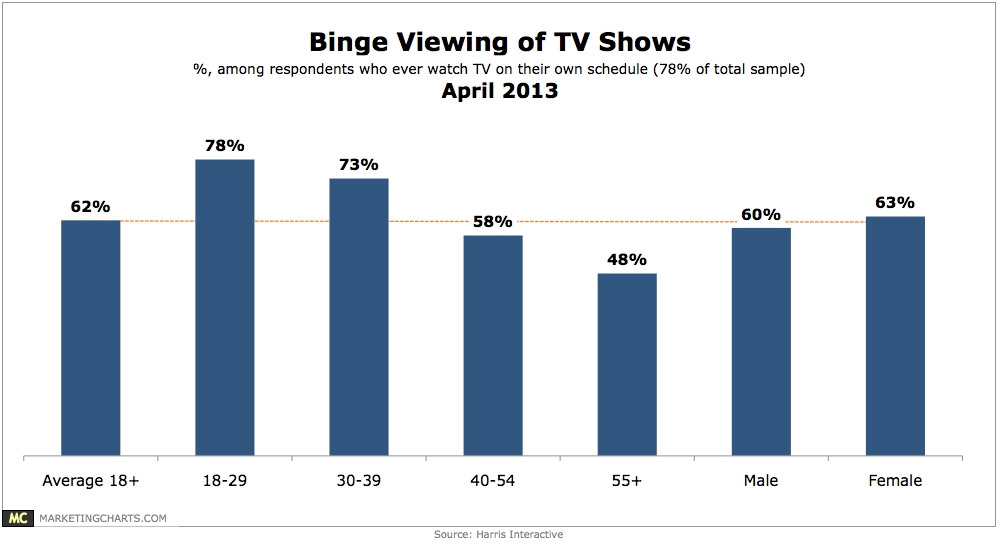
Read MoreBinge TV Viewing By Generation & Gender, April 2013 [CHART]
78% of Americans have watched TV on [their] own schedule and 62% of those have watched multiple episodes of a TV show at a time.
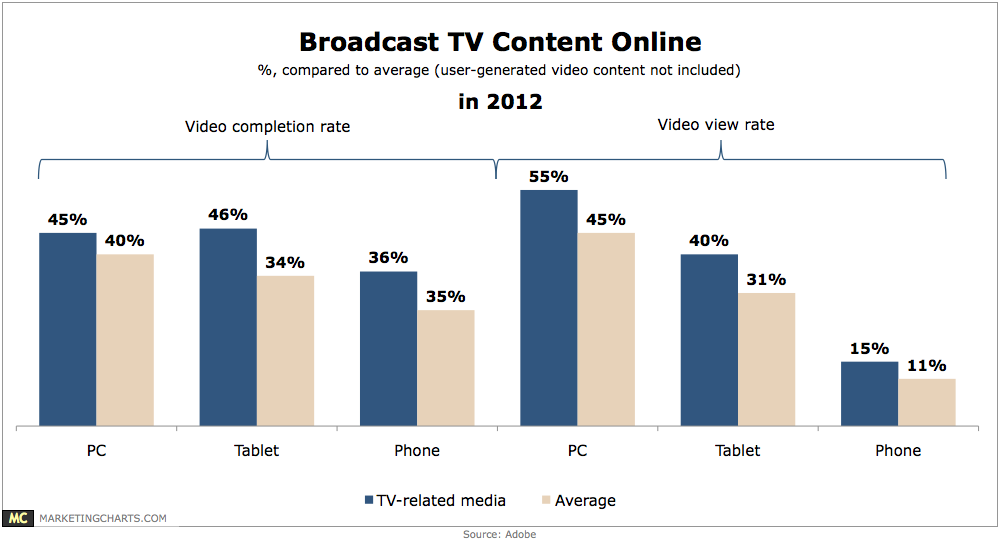
Read MoreBroadcast TV Content Completion Rates Online By Device, 2012 [CHART]
Compared to the average, completion rates for TV-related content (such as full episodes of TV shows) are 12.5% higher on PCs (45% vs. 40%), 31.4% higher on tablets (46% vs. 35%), and 33.3% higher on mobile phones (36% vs. 27%).
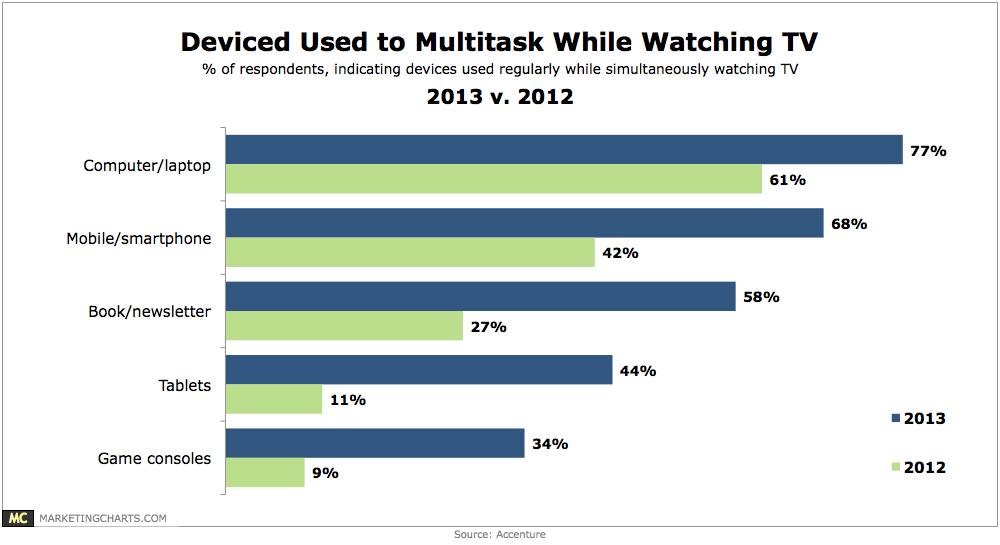
Read MoreDevices Use For Multitainment, 2012 vs 2013 [CHART]
Regular use of tablets while watching TV (on a TV set) has soared from 11% in 2012 to 44% this year.
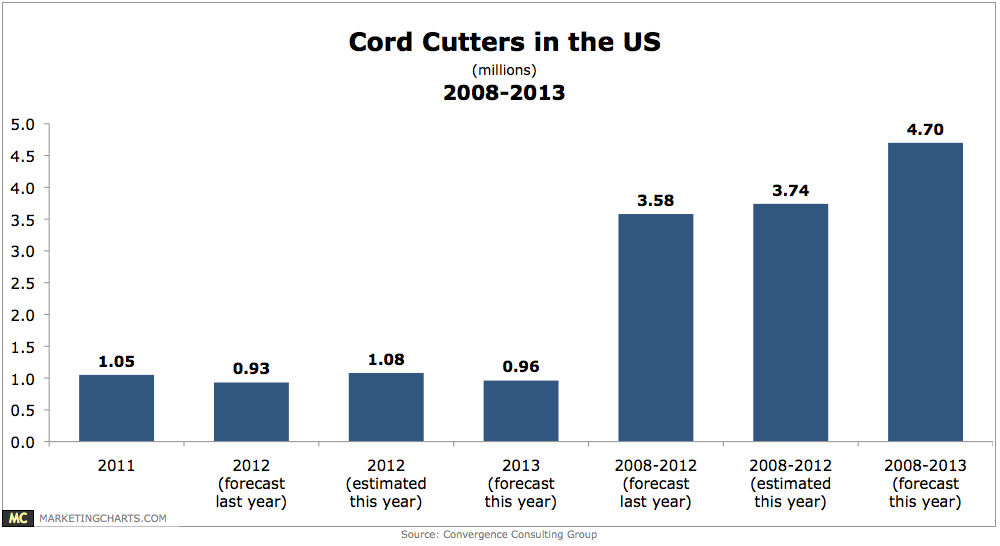
Read MoreAmerican Cord Cutters, 2008-2013 [CHART]
The number of American pay TV subscribers cutting the cord to focus solely on Netflix, over the air, online, and other sources is growing faster than expected.
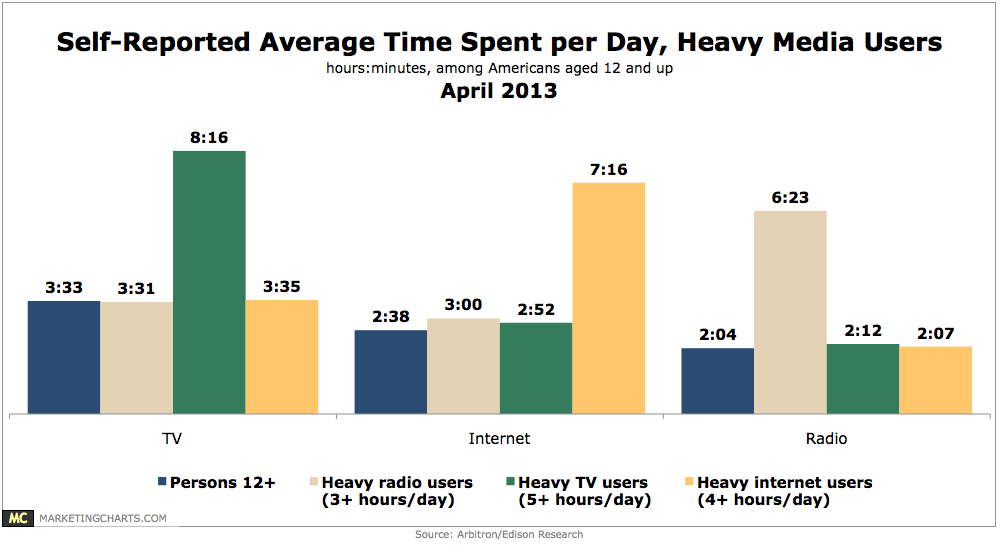
Read MoreTime Spent Consuming Media By Select Channels, April 2013 [CHART]
Heavy usage of one of the top 3 media (by reach) does not necessarily mean that less time is spent with the other media.
Read More