Posts Tagged ‘Television’
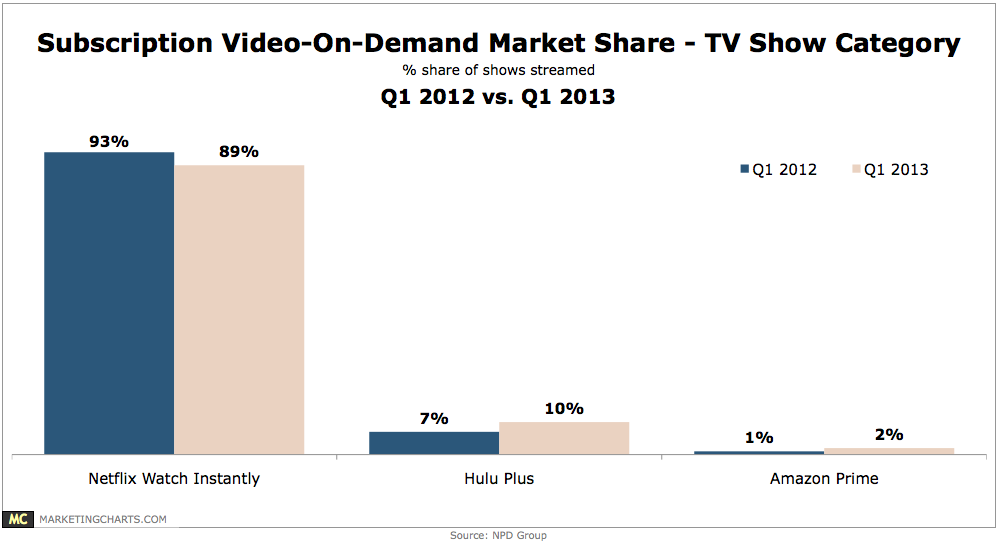
Subscription On-Demand Video Market Share, Q1 2012 vs Q1 2013 [CHART]
Netflix accounts for almost one-third of North American peak downstream internet traffic.
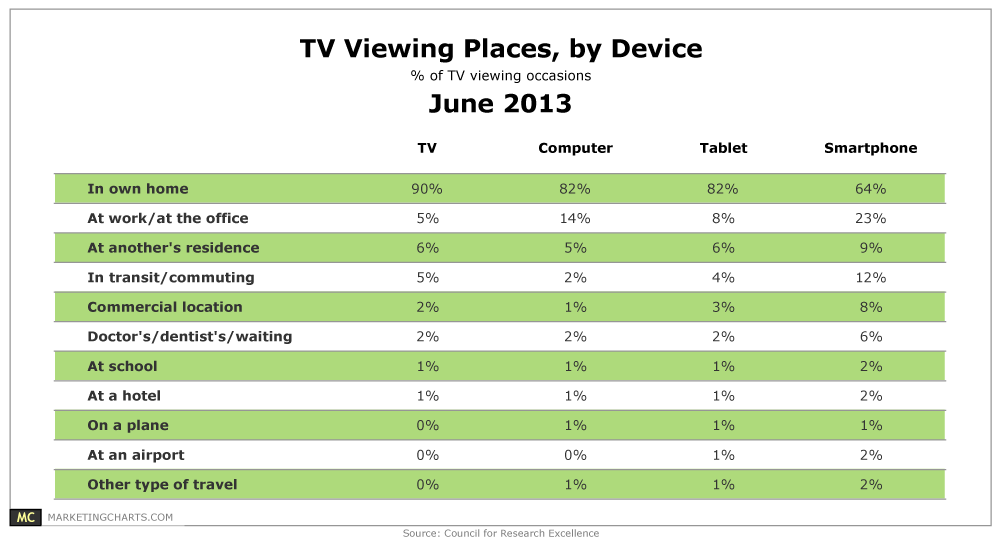
Read MoreTelevision Viewing Places By Device, June 2013 [TABLE]
64% of smart phone TV viewing occasions occurred at home.
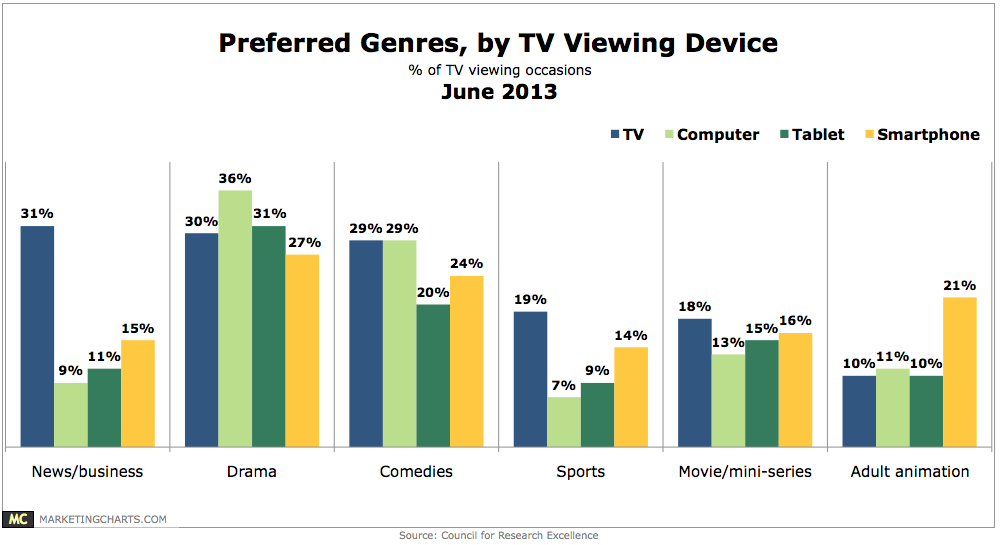
Read MorePreferred Television Genres By Viewing Device, June 2013 [CHART]
On the traditional TV, news and business (31%) got the edge on drama (30%) and comedies (29%) as the top genres by percentage of viewing occasions.
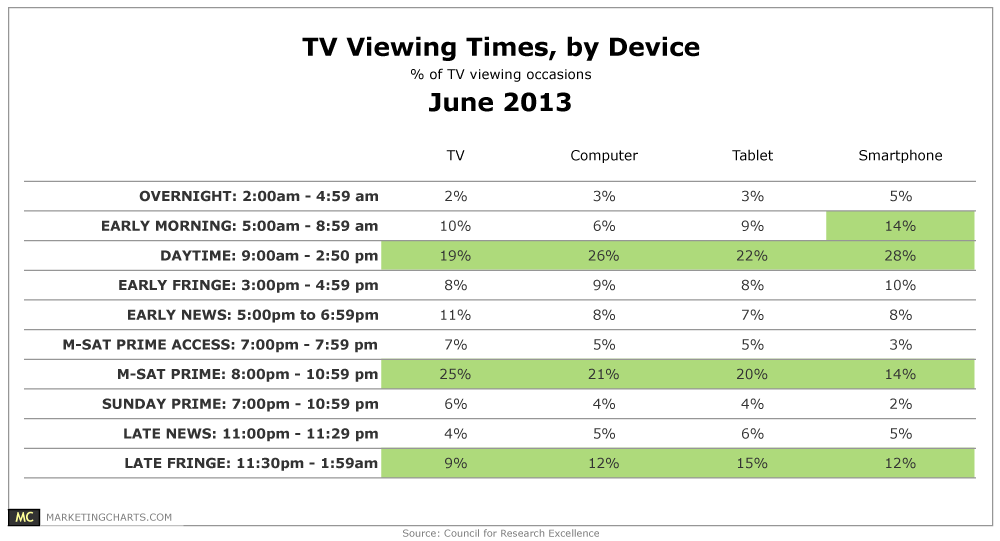
Read MoreTV Viewing Times By Device, June 2013 [TABLE]
A plurality of tablet (22%) and smart phone (28%) TV viewing occasions tracked occurred during the daytime, between 9 AM and 3 PM.
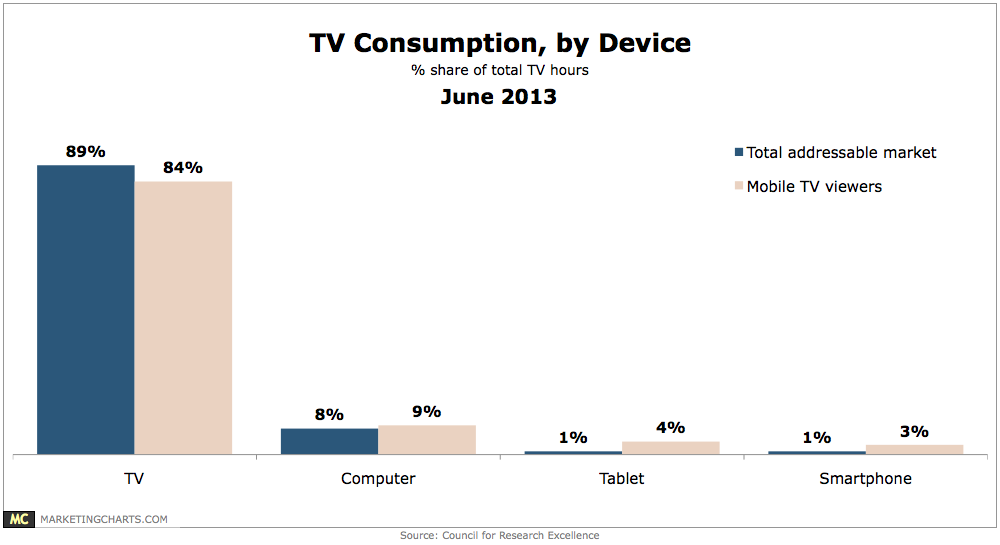
Read MoreTelevision Consumption By Device, June 2013 [CHART]
Just 2% of all TV hours logged were on tablets (1%) or smart phones (1%).
Read MoreTwitter & Nielsen Team Up For Second Screen Data Analysis [VIDEO]
Beyond Social Media hosts discuss social TV & the Twitter/Nielsen partnership to understand second screen behavior and behaviorally-targeted advertising.
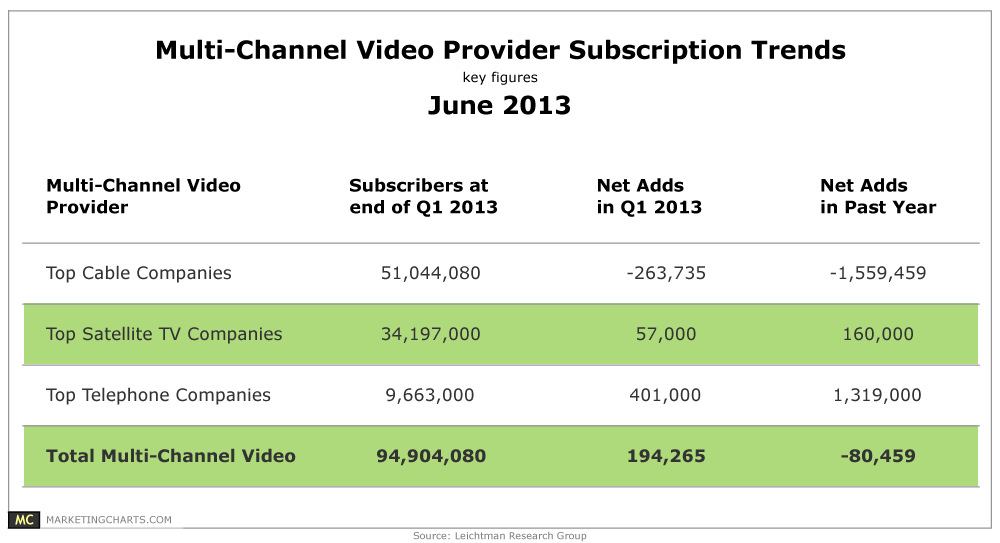
Read MoreMultichannel Video Provider Subscription Trends, June 2013 [TABLE]
The top multi-channel video providers, who represent about 94% of the market, posted their first overall subscriber loss over a four-quarter period (between Q2 2012 and Q1 2013).
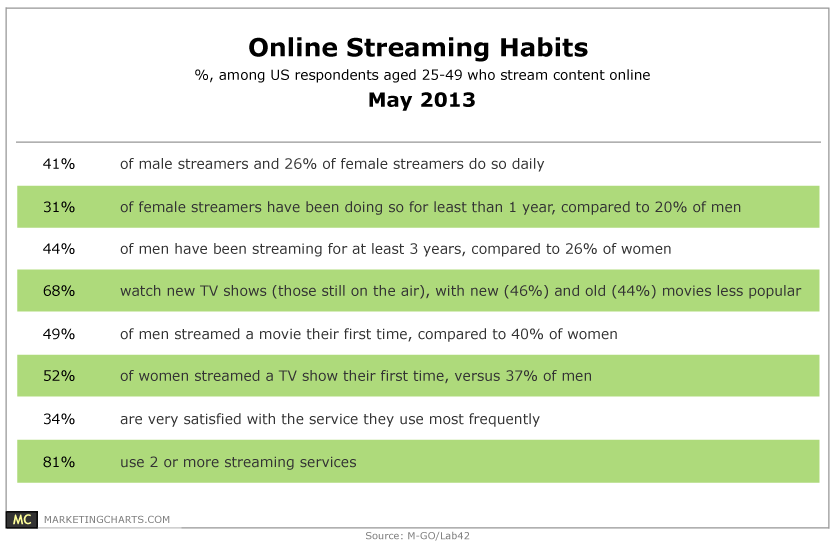
Read MoreOnline Streaming Habits, May 2013 [TABLE]
A survey from M-GO of streaming media consumers finds that new TV shows are their most popular type of programming, cited by 68% of respondents, with new movies (46%) and older movies (44%) in tow.
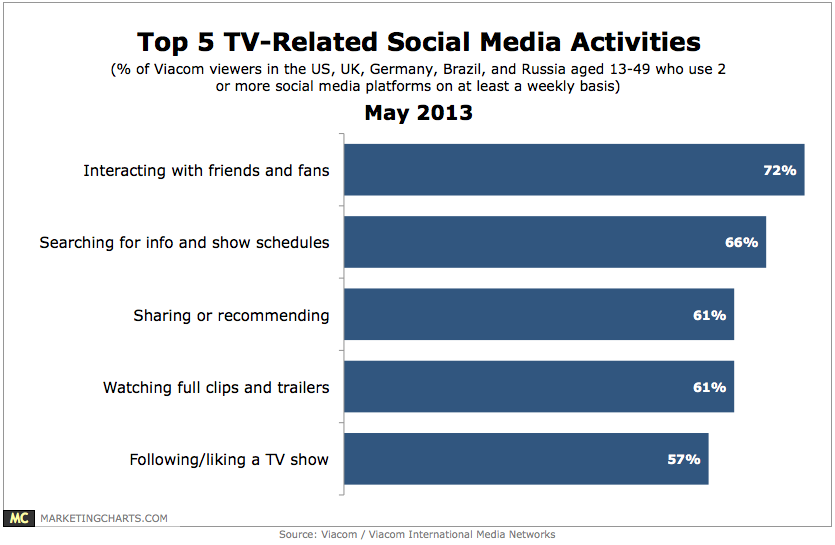
Read MoreTop 5 TV-Related Social Media Activities, May 2013 [CHART]
Viewers average 10 TV-related activities on social media on a weekly basis.
Read MoreHow Millennials Spend Their Free Time By Gender, May 2013 [CHART]
58% of Millennial men said they watch TV, with about 4 in 10 saying they listen to or play music.
Read More