Posts Tagged ‘Television’
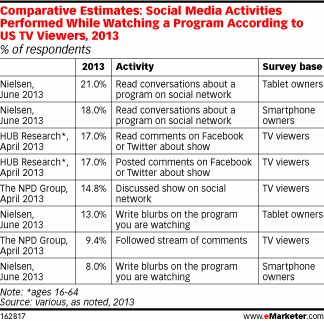
Social Media Activities Performed While Watching TV, 2013 [TABLE]
15% to 17% of TV viewers engaged in real-time socializing about the television shows they were watching.
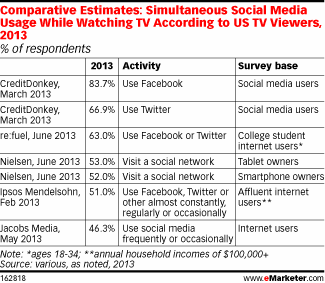
Read MoreSocial TV Behavior Of American TV Viewers, 2013 [TABLE]
A majority of social media users, tablet owners and smart phone users have used social networks while watching television.
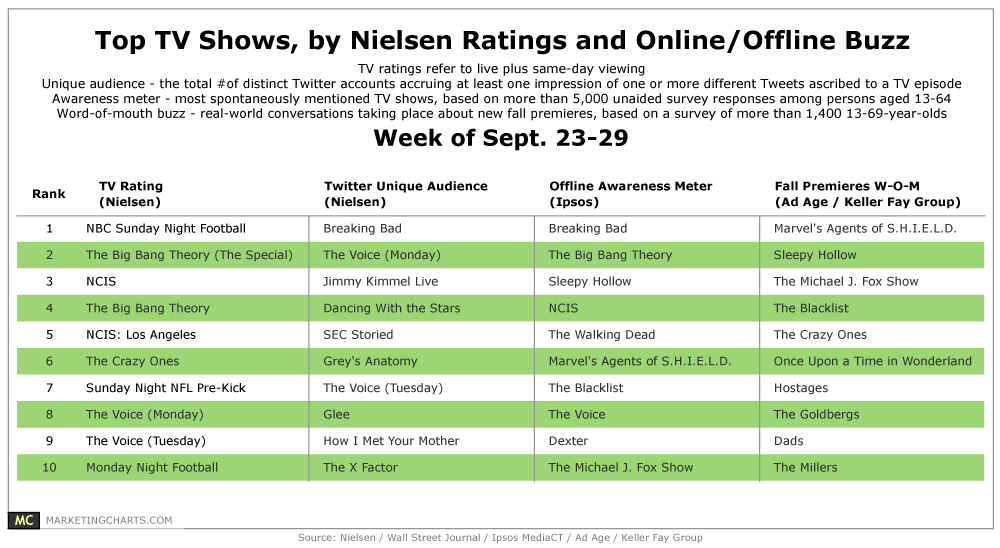
Read MoreMost Popular TV Shows By On- & Offline Buzz, September 23-29, 2013 [TABLE]
The number of tweets about TV grew by 38% year-over-year in Q2 to reach 263 million, while the number of authors tweeting about TV grew by 24% to 19 million.
Read MoreTV Viewers' Attitudes Toward Pay-TV, October 2013 [TABLE]
TV viewers themselves believe that pay-TV will be largely replaced by alternative viewing sources in the next 5 years.
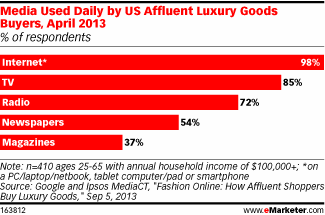
Read MoreLuxury Goods Buyers' Daily Media Consumption, April 2013 [CHART]
Among those with an annual household income of at least $100,000 who had purchased at least two luxury items in the past two years—98% went online daily.
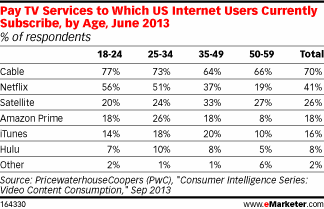
Read MorePay TV Subscribers By Channel & Age, June 2013 [TABLE]
Seventy percent of respondents shelled out for cable TV, while only 41% splurged on Netflix.
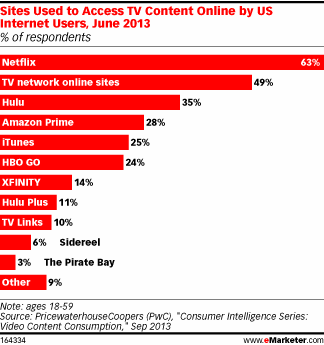
Read MoreTop Sites Used To Watch TV, June 2013 [CHART]
More than six in 10 respondents said they relied on Netflix to watch shows.
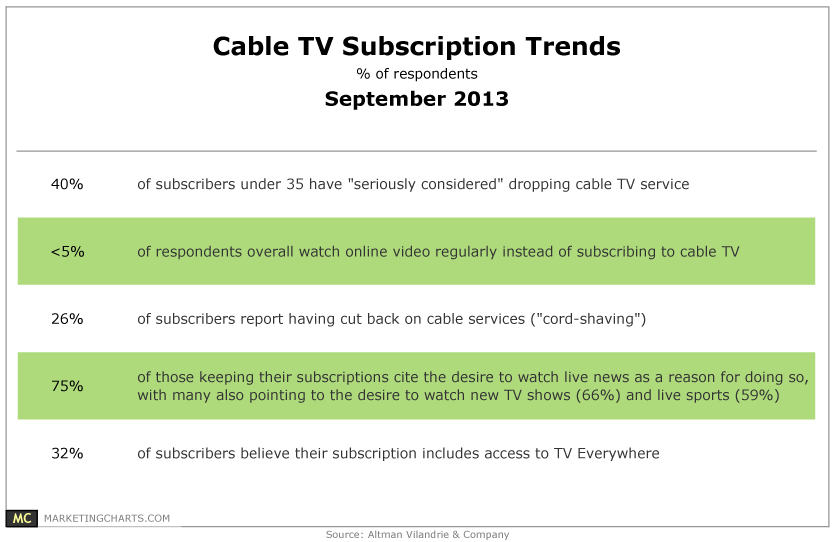
Read MoreCable TV Subscriber Attitudes, September 2013 [TABLE]
The number of TV cord-cutters has been rising more quickly than expected of late, but represented only about 1% of pay-TV subscribers last year.
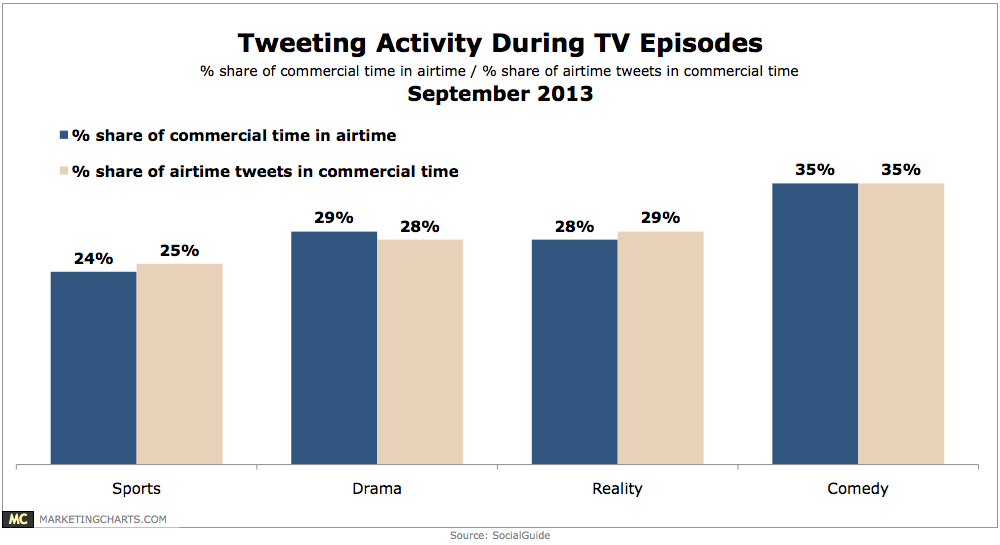
Read MoreSocial Television Behavior By Genre, September 2013 [CHART]
30% of airtime tweets are posted during commercial breaks, a figure that corresponds to the share of commercial time during the episodes’ airtimes.
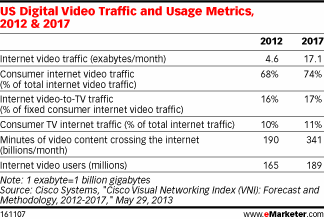
Read MoreUS Online Video Traffic & Useage Metrics, 2012 & 2017 [TABLE]
In 2012 averaged 4.6 exabytes per month, and by 2017, that figure will more than triple to 17.1 exabytes per month.
Read More