Posts Tagged ‘Television’
Online Behavior Of The Home Improvement Customer [INFOGRAPHIC]
This infographic illustrates the online behavior of home improvement customers by generation.
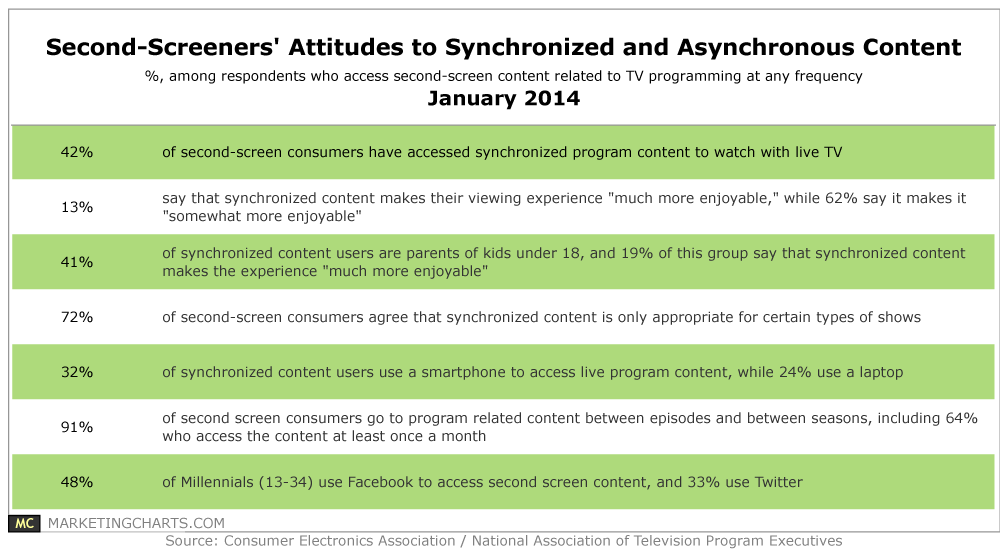
Read MoreSecond-Screeners' Attitudes Toward Synchronized & Asynchronous Content, January 2013 [TABLE]
Only 4 in 10 respondents reported trying synchronized program content to watch with live TV, and few found that it significantly enhanced their experience.
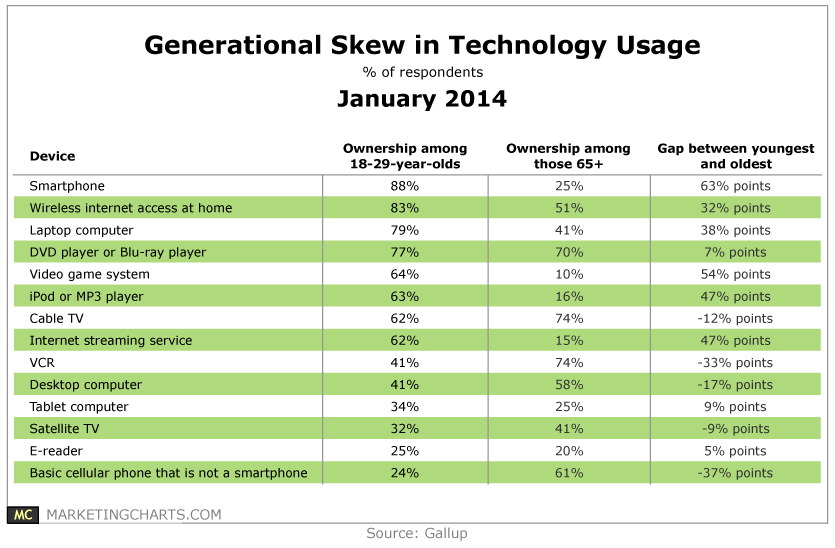
Read MoreTechnographic Generational Gap By Device, January 2014 [TABLE]
Gallup measured the penetration rates of 14 consumer electronic devices among 18-29-year-olds and those aged 65 and up.
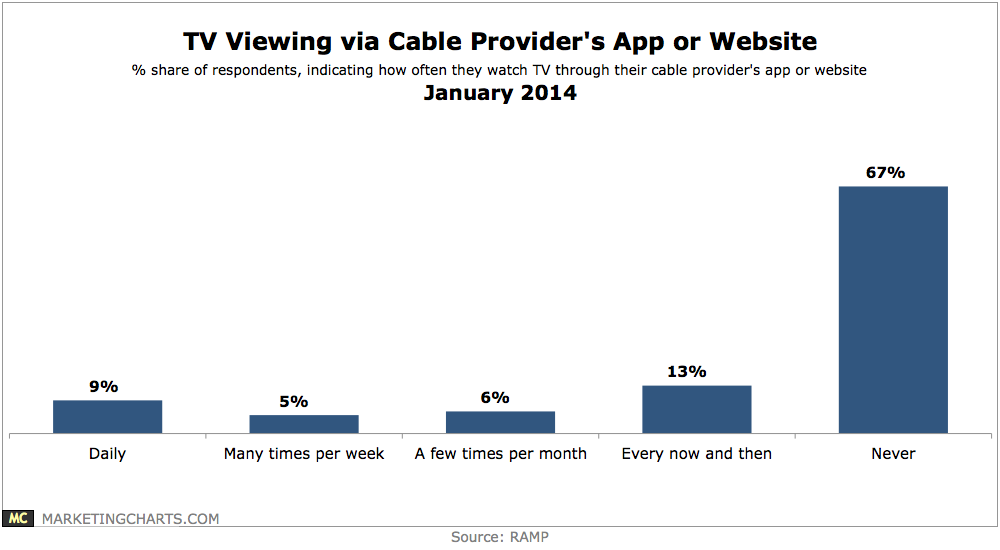
Read MoreTV Viewing Via Cable Provider's App Or Website, January 2014 [CHART]
Some 80% of respondents are unaware of TV Everywhere.
Read MoreUS Gaming Market Size By Screen, December 2013 [CHART]
170 million Americans play videogames, and 60% of those gamers spend money doing so, resulting in an estimated $20.5 billion in spending by the end of this year.
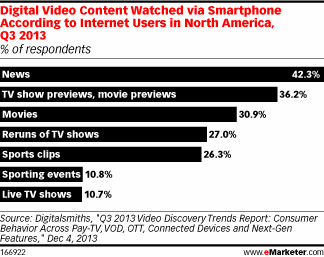
Read MoreTypes Of Video People Watch On Their Smart Phones, Q3 2013 [CHART]
Just over 42% of internet users in North America watched news video content on their smart phones.
Read MoreTop TV Programs Of 2013 [TABLE]
As in 2011 and 2012, this year’s top TV programs were almost exclusively the realm of NFL telecasts.
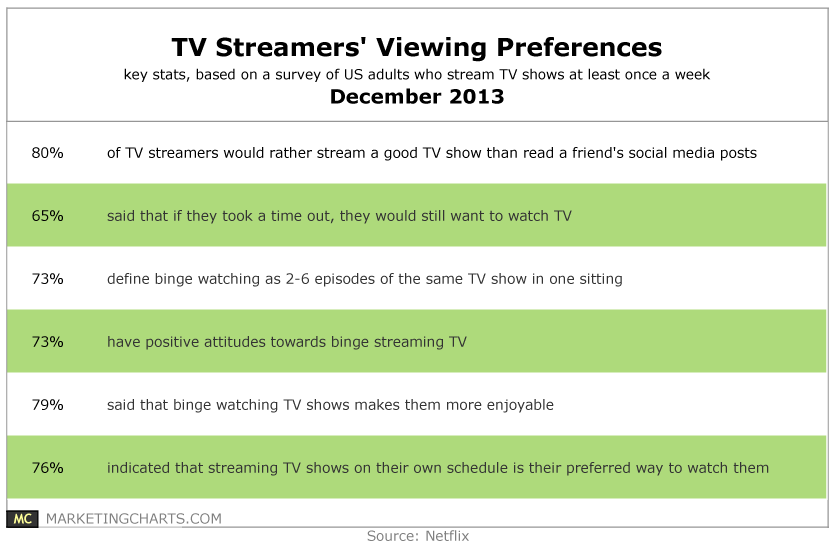
Read MoreTV Streamers' Viewing Preferences, December 2013 [TABLE]
Two-thirds of TV streamers said that if they took a digital time out, they’d still want to watch TV.
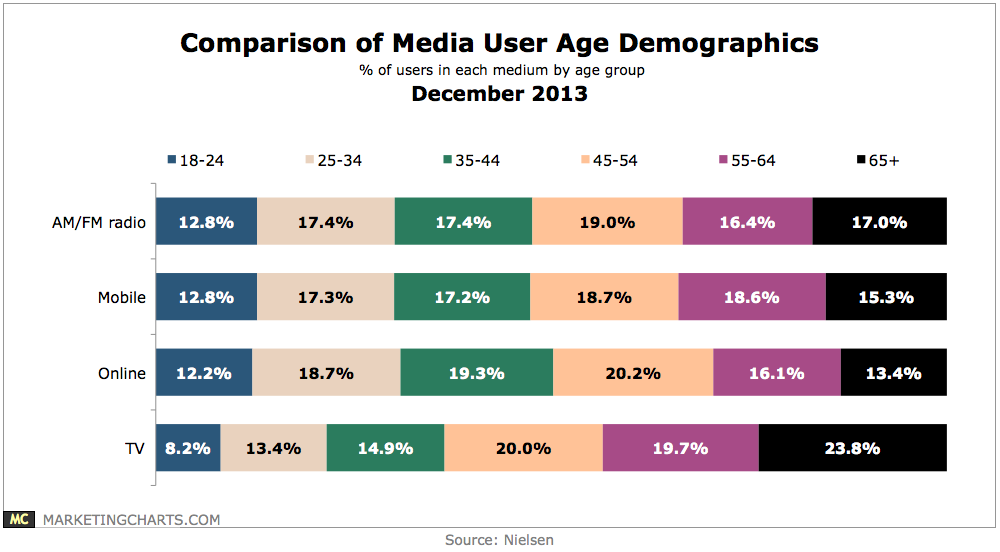
Read MoreMedia Users By Age & Channel, December 2013 [CHART]
More than 9 in 10 Americans listen to radio on a weekly basis, with those figures highest among Hispanics (94%) and African-Americans (92%).
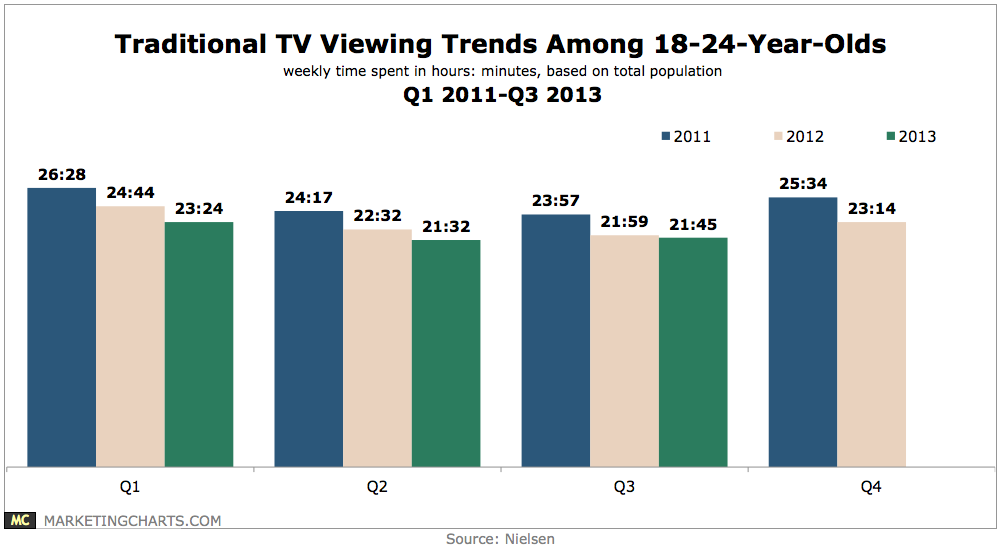
Read MoreTraditional TV Viewing Trends Among 18-24 Year Olds, Q1 2011-Q3 2013 [CHART]
While Millennials are indeed watching less TV, it’s not yet as precipitous a decline as one might be led to believe.
Read More
