Posts Tagged ‘Television’
TV & Twitter Behavior, June 2014 [TABLE]
Twitter-supported TV campaigns drive increased awareness, favorability and sales, ultimately leading to higher ROI.
Read MoreShare Of Video Plays By Duration & Device, Q1 2014 [CHART]
Almost 90% of video plays on smartphones were less than 10 minutes in length, and roughly 80% of video plays on tablets were also short-form video.
Read MoreAverage Time Spent Per Day By Device, 2010-2014 [TABLE]
In a marketing world driven ever more by data, content marketing remains very much an art form, especially in the business-to-consumer arena.
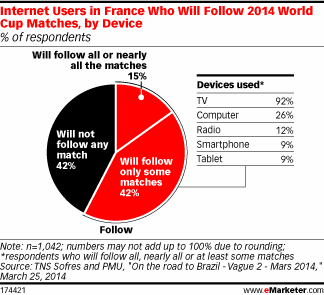
Read MoreFrench 2014 World Cup Watchers By Device [CHART]
Out of the 57% of internet users in France who said they would follow at least some of the tournament’s games, just 9% planned to use a smartphone to do so.
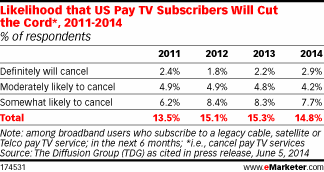
Read MoreLikelihood Pay TV Subscribers Will Cut The Cord, 2011-2014 [TABLE]
The percentage of pay TV subscribers who were likely to cancel their cable services had held steady between 2011 and 2014.
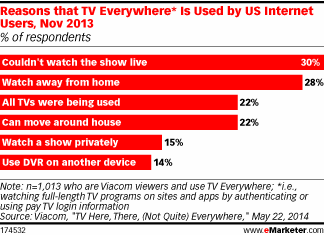
Read MoreReasons People Watch TV Everywhere, November 2013 [CHART]
Flexibility is the main reason today’s busy, on-the-go consumers are taking advantage of TV Everywhere.
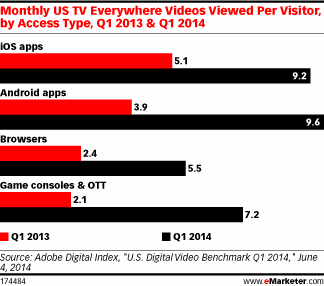
Read MoreMonthly TV Everywhere Videos Viewed By Device, Q1 2013 & Q1 2014 [CHART]
The number of unique TV Everywhere visitors in the US rose 157% between Q1 2013 and Q1 2014 and 49% between Q4 2013 and Q1 2014.
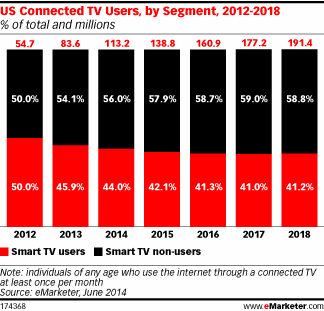
Read MoreUS Smart TV Users vs Dumb TV Users, 2012-2018 [CHART]
The share of smart TV users as a percentage of connected TV users will decrease slightly between 2014 and 2018, while the portion of smart TV non-users will rise.
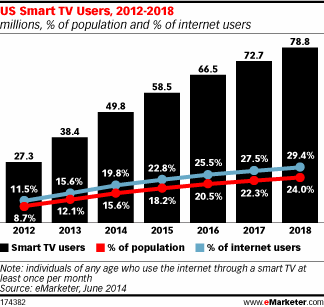
Read MoreUS Smart TV Users, 2012-2018 [CHART]
eMarketer forecasts that the number of US smart TV users will reach 49.8 million in 2014, or 15.6% of the population and 19.8% of internet users.
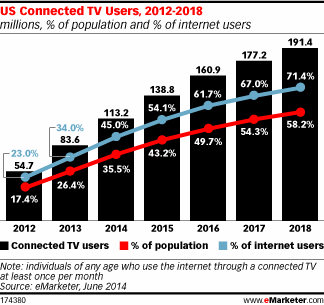
Read MoreUS Connected TV Users, 2012-2018 [CHART]
eMarketer estimates that more than 113 million people—35.5% of the US population and 45.0% of internet users—will use a connected TV regularly this year.
Read More