Posts Tagged ‘Telecom Marketing’
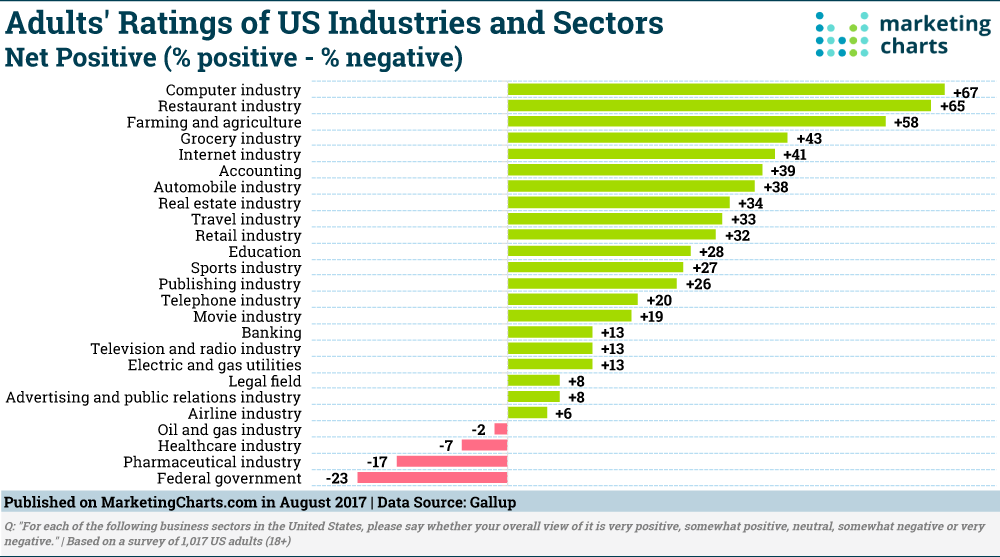
Industry Reputations [CHART]
It’s hard to sell to a public that doesn’t view you well… Yet that’s the task faced by the advertising and public relations industry, which continues to rank towards the bottom of all industries in public perception.
Read MoreMobile Device Share Of Online Conversions, August 2013 [CHART]
A study of 100 million conversion events across 4 major verticals and multiple devices reveals that 31% of said conversions took place on a mobile device.
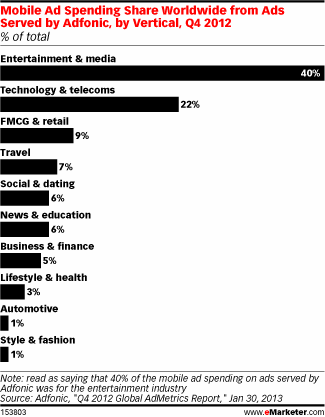
Read MoreGlobal Mobile Ad Spending Share By Vertical, Q4 2012 [CHART]
The worst performers on tablets vs. smart phones were the fast-moving consumer goods and retail industry, along with the social and dating category.
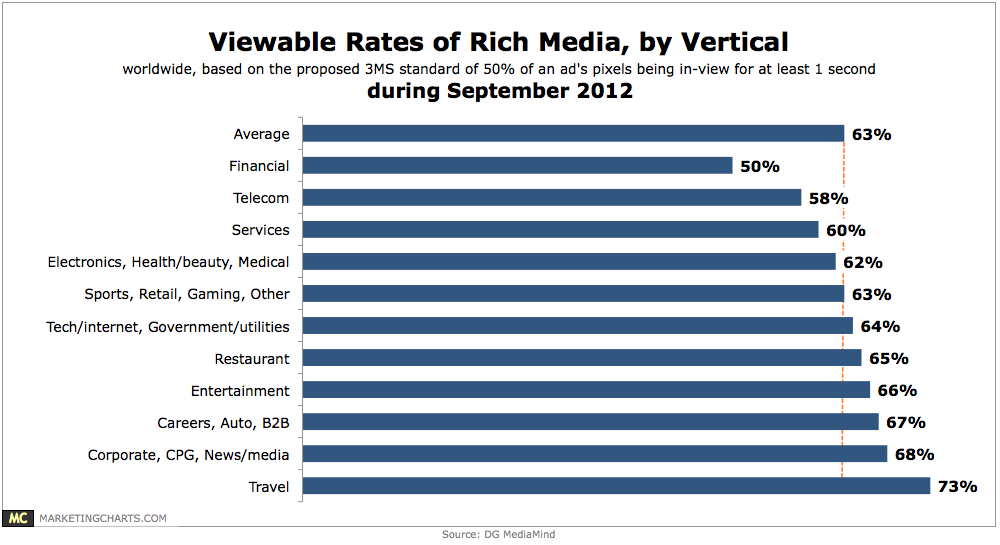
Read MoreRich Media Viewability By Vertical, September 2012 [CHART]
63% of rich media ads are viewable.
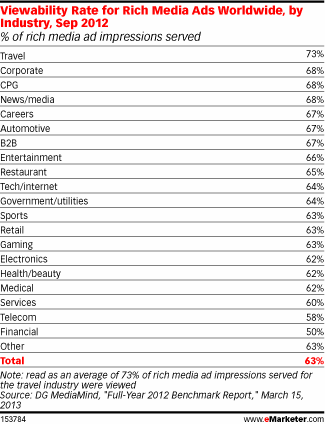
Read MoreViewability Rate For Rich Media Ads By Industry, September 2012 [TABLE]
Rich media ads purchased by firms in the travel industry were most likely to be viewable, at 10 percentage points above average, while those in the financial vertical were only seen half the time.
Read MoreTop 10 Advertising Sectors In 2012 [CHART]
At roughly $16.3 billion – up 3% from $15.9 billion in 2011 – the retail sector accounted for more than 11% of total US ad spend (excluding FSI/PSA).
Read MoreTop American Advertising Verticals, Q3 2012 [CHART]
US ad spend grew 7% year-over-year in Q3.
Read MoreGoogle Ad Conversion Rates By Industry, Q3 2012 [CHART]
Of the 10 industries that spent the most on Google ads in Q3 2012, the Internet and Telecommunications industry achieved the best overall results.
Read MorePre-Roll Video Ad Metrics By Industry, Q2 2012 [CHART]
In-stream video buying platform VideoHub reported in Q2 that US online pre-roll CPG video ads had a 73.03% completion rate, slightly above the average for all industries.
Read MoreHow Google Makes $100 Million A Day [INFOGRAPHIC]
This infographic by WordStream breaks down Google’s daily ad revenue.
Read More