Posts Tagged ‘Technology Marketing’
Moms' Social Sharing By Content Type, May 2013 [CHART]
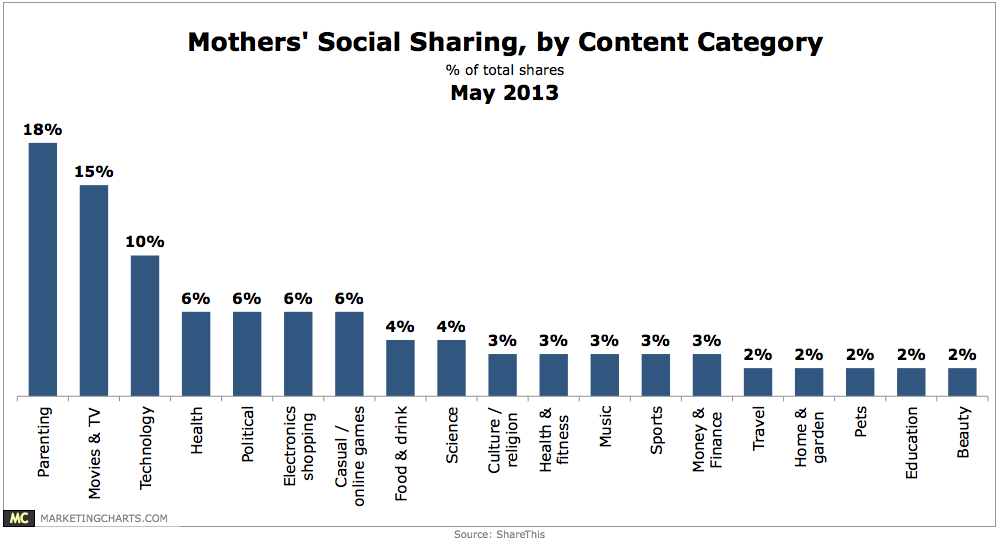
30% of mothers shared content on the ShareThis network during the period, compared to 10% of the network’s overall average.
Read MoreNorth Americans' Spending Intentions, May 2013 [CHART]
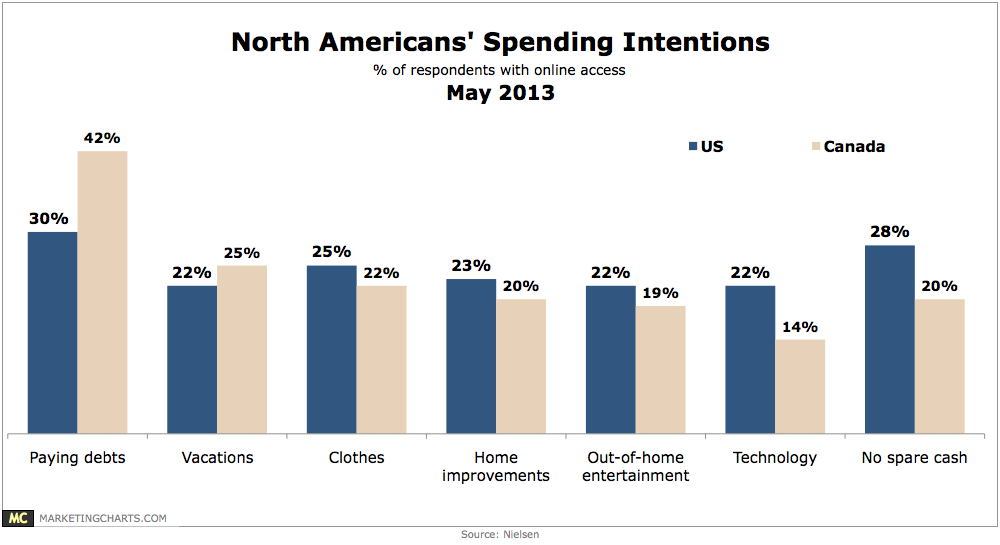
North Americans plan to spend on discretionary items this year, up from 36% the previous quarter.
Read MoreOnline Social Video Ads Shared Worldwide By Industry, Q1 2013 [CHART]
Entertainment garnered the most social video shares in Q1 2013, which is unsurprising given the adeptness of the industry at creating video content.
Read MoreAmerican Retail eCommerce Sales CAGR By Category, 2012-2017 [CHART]

A mix of larger and smaller online product categories will post the highest CAGRs from 2012 to 2017.
Read MoreAmerican Retail eCommerce Sales By Product Category, 2011-2016 [TABLE]
Computer and consumer electronics, as well as apparel and accessories, account for the bulk of US retail eCommerce sales.
Read MoreSocial Video Advertising Shares By Industry, Q1 2013 [CHART]
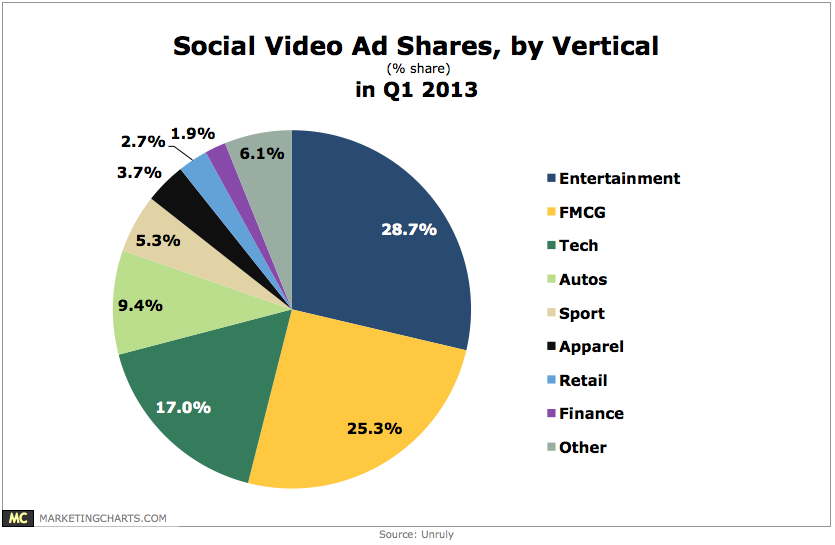
Fast-moving consumer goods ad campaigns generated almost 8.7 million shares during the quarter, up 78.2% from Q4 2012, and representing 25.3% of all shares.
Read MoreGlobal Mobile Ad Spending Share By Vertical, Q4 2012 [CHART]
The worst performers on tablets vs. smart phones were the fast-moving consumer goods and retail industry, along with the social and dating category.
Read MoreTablet Ad Click-Through Rate Uplift By Industry, December 2012 [CHART]
Click-through rates for entertainment and media, as well as the travel category rose by 81% and 66%, respectively.
Read MoreTablet Traffic To US Websites Of Select Industries, January 2013 [CHART]
The top-performing retailer site studied got 13% of internet traffic from tablets.
Read MoreUS Smart Phone Website Traffic To Select Industry Websites, January 2013 [CHART]
The top-performing site that got the greatest share of traffic from smart phones was in the media and entertainment category.
Read More