Posts Tagged ‘Tablets’
Top Mobile Apps Used For Local Business Search, December 2012 [TABLE]
Google Maps was the No. 1 app used for local searches on phones and tablets, at 35% and 25%, respectively.
Read MoreDevices Used By Stage Of Local Business Searches, December 2012 [CHART]
Where mobile phones and tablets really showed their specific utility was in the share of local searches that ended on the devices—18% for each, compared with 4% of PC searches.
Read MoreMobile Americans Who Use Search/Navigation Sites or Apps, April-December 2012 [CHART]
In only eight months, the number of overall US searches on mobile phones and tablets rose 21%.
Read MoreDevices Use For Multitainment, 2012 vs 2013 [CHART]
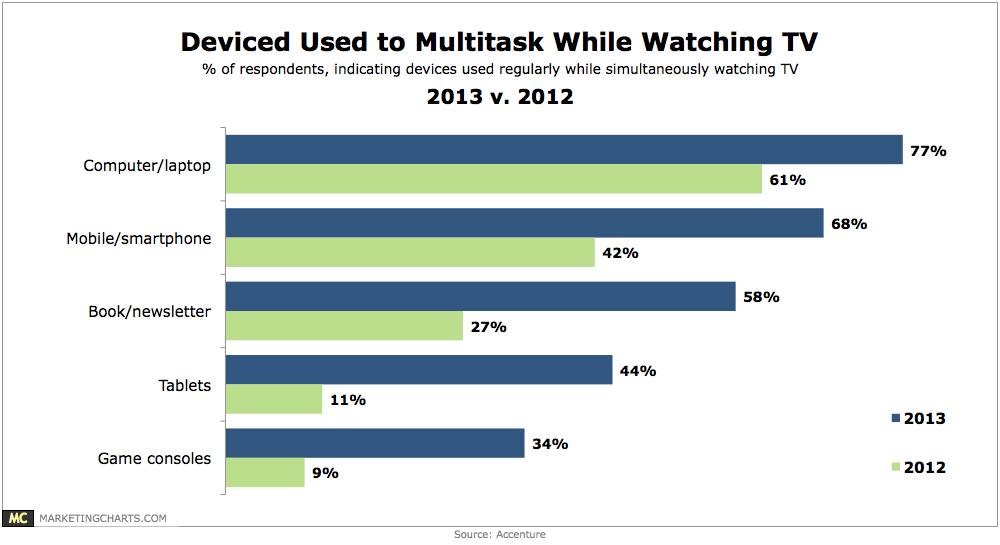
Regular use of tablets while watching TV (on a TV set) has soared from 11% in 2012 to 44% this year.
Read MoreMost Influential Ad Platforms For Automotive Purchase Decisions, March 2012 [CHART]
55% of respondents’ digital ad spending went to paid search engine marketing (SEM).
Read MoreTop Sources For Coupons, April 2013 [CHART]
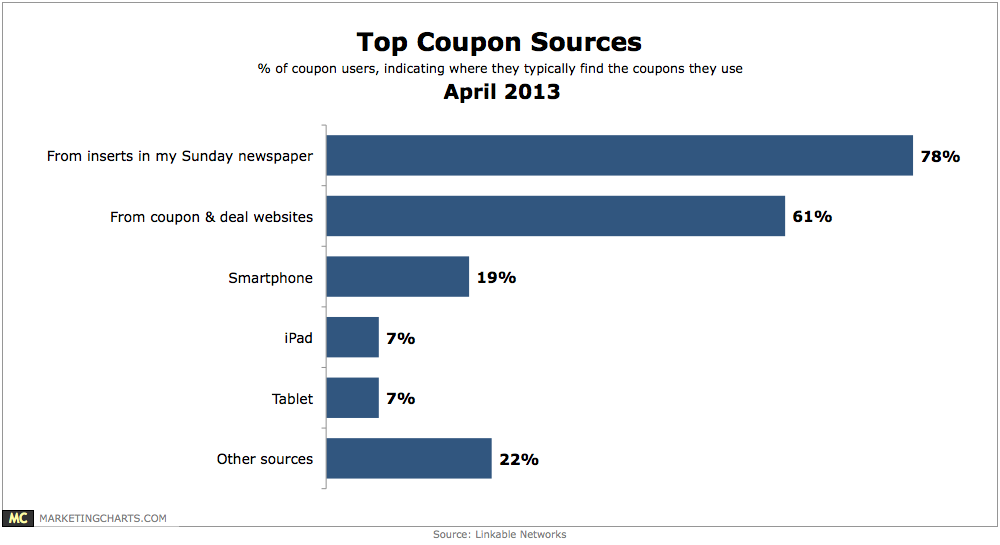
95% of consumers use coupons when they shop, including 30% who claim to do so every time they shop.
Read MoreTop Tablet Ad Models' Performance, April 2013 [CHART]
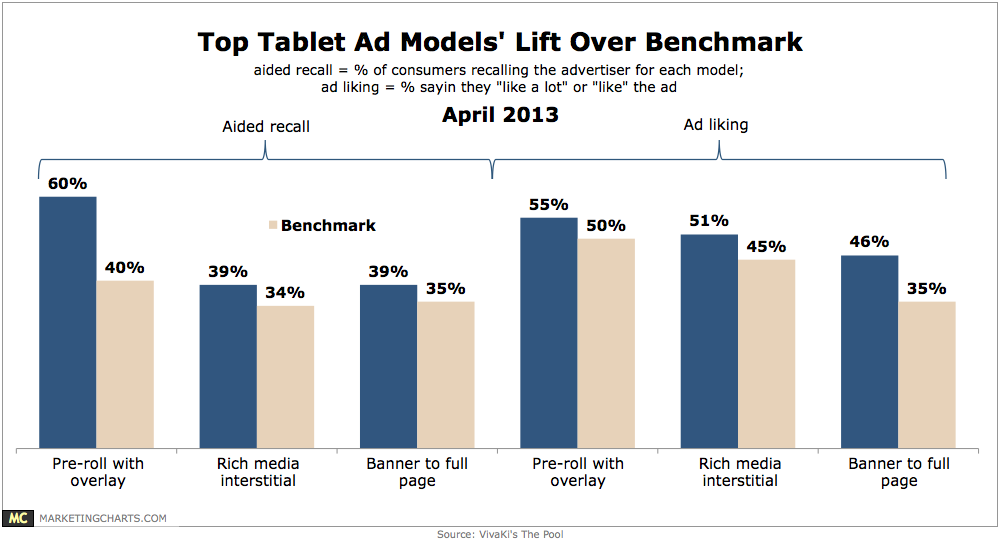
An exhaustive global study concludes that the top three tablet advertising models are pre-roll with overlay; rich media interstitial; and banner to full page rich media.
Read MoreMultiscreen Behavior With Facebook & Twitter By Gender, March 2013 [CHART]
Women were slightly more likely than men to turn to social media while watching TV, traveling and exercising, and significantly more likely to do so while shopping.
Read MoreTime Spent On iOS & Android Devices By Activity, April 2013 [CHART]
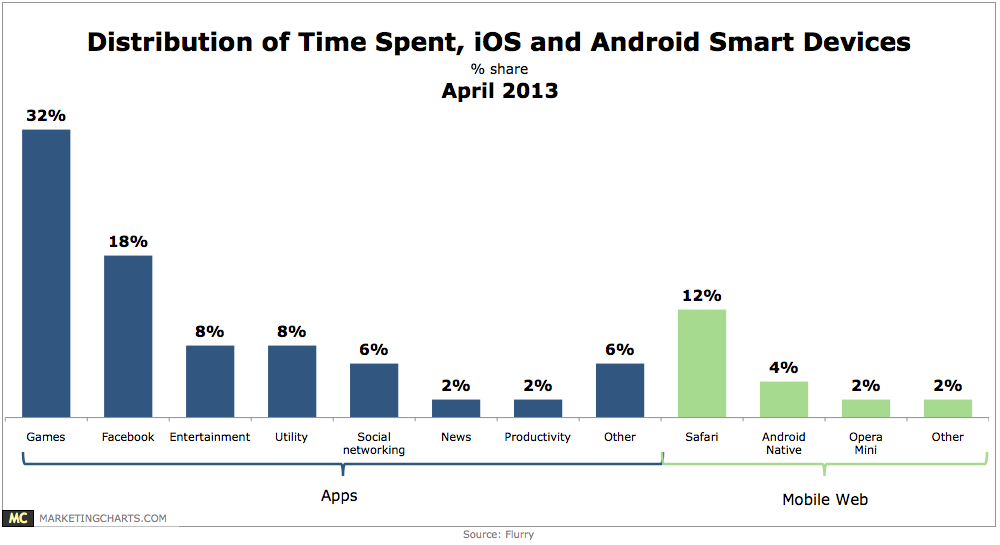
Android and iOS smart phone and tablet users spend an average of 2 hours and 38 minutes per day on their devices.
Read MoreOnline Viewership For Broadcast TV, March 2013 [TABLE]
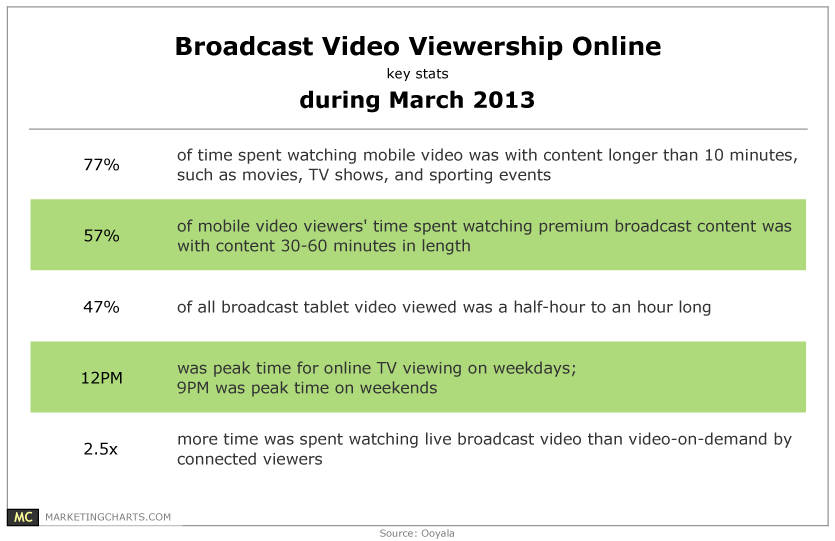
Connected viewers watched live broadcast video 2.5 times longer than video on demand (VOD), while 77% of time spent watching mobile video was with content longer than 10 minutes, such as movies, sporting events, and TV shows.
Read More