Posts Tagged ‘Tablets’
Share of eCommerce Traffic From Smart Devices, Q1 2012 – Q1 2013 [CHART]
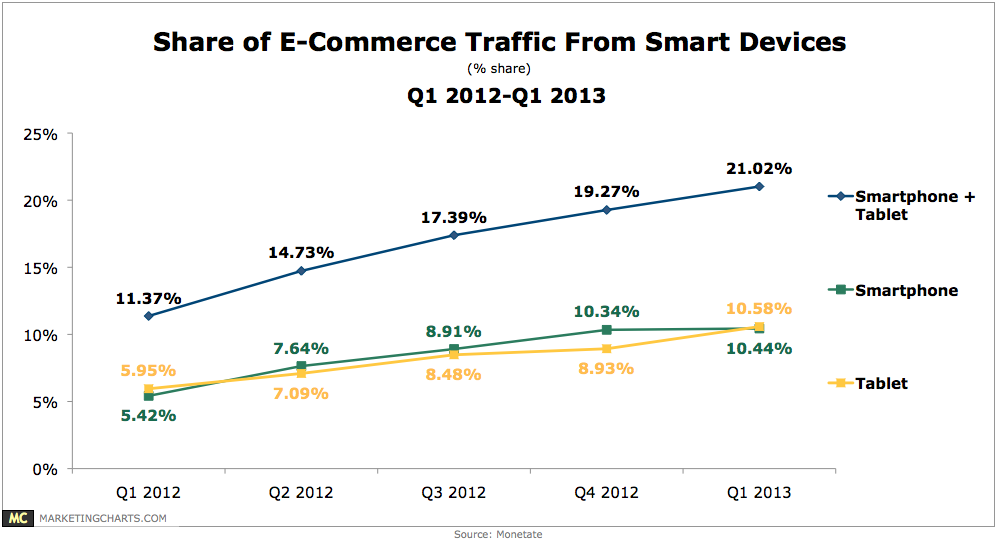
Tablets accounted for 10.6% of e-commerce site traffic in Q1, up from 8.9% a quarter earlier, while smartphones also exceeded 10% of traffic (10.44%), though with only slight growth from the previous quarter.
Read MoreCross-Device Travel Research & Purchase Behavior, May 2013 [CHART]
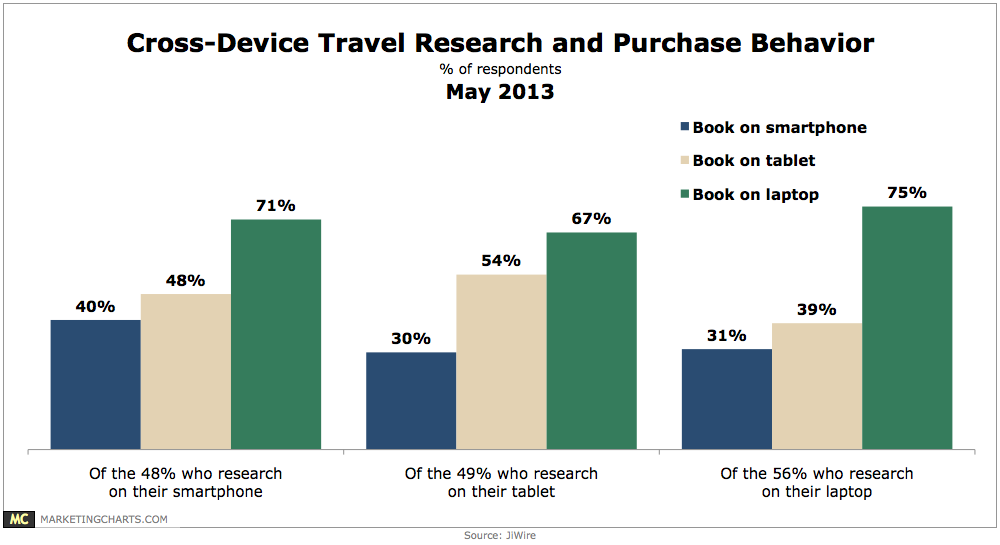
Among mobile owners who booked travel in the past 90 days, only 53% used a single device (smart phone, tablet, or laptop) to do so.
Read MoreRetail Mobile Path To Purchase, May 2013 [TABLE]

Just 6% of smartphone users conducted their most recent mobile retail search in-store.
Read MoreMary Meeker: State of the Internet, 2013 [PRESENTATION]
Mary Meeker’s latest edition of the annual Internet Trends report finds continued robust online growth.
Read MoreAccepting Advertising For Free Content, May 2013 [CHART]
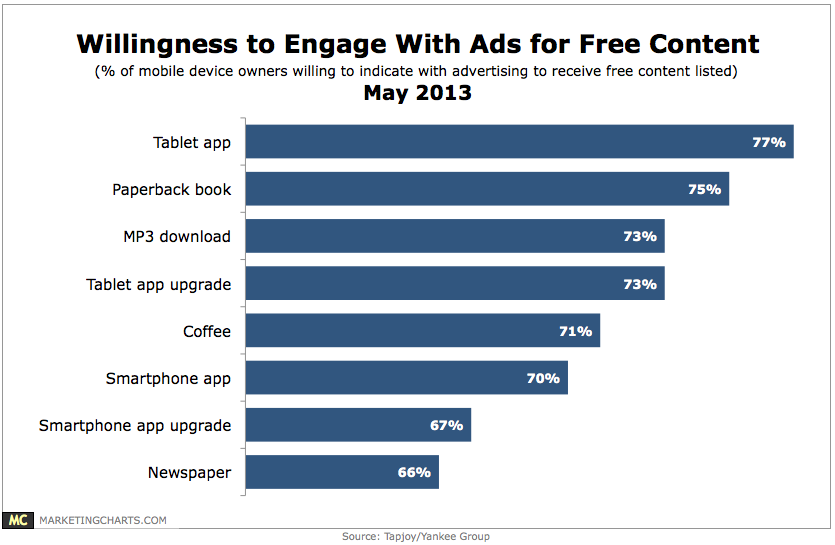
Mobile device owners would prefer to spend time engaging with advertising in order to receive free content, whether that be a tablet (77%) or smartphone (70%) application, or even a newspaper (66%).
Read MoreDevice Ownership Among American Children & Teens, November 2012 [TABLE]
43% of children ages 3 to 18 used the smart phone, with 65% of that group doing so on a daily basis.
Read MoreAmount Of Mobile Shopping By American Moms, December 2012 [CHART]

Only 11% of moms said mobile was the shopping method they would choose, if given only one option.
Read MoreProduct Categories That Interest Mobile Moms, March 2013 [CHART]
Clothing and beauty ranked as the top product categories for which moms shopped on their smart phones and tablets, at 56% and 47%, respectively.
Read MoreMobile Connected Device Mix, Q1 2012 – Q1 2013 [CHART]
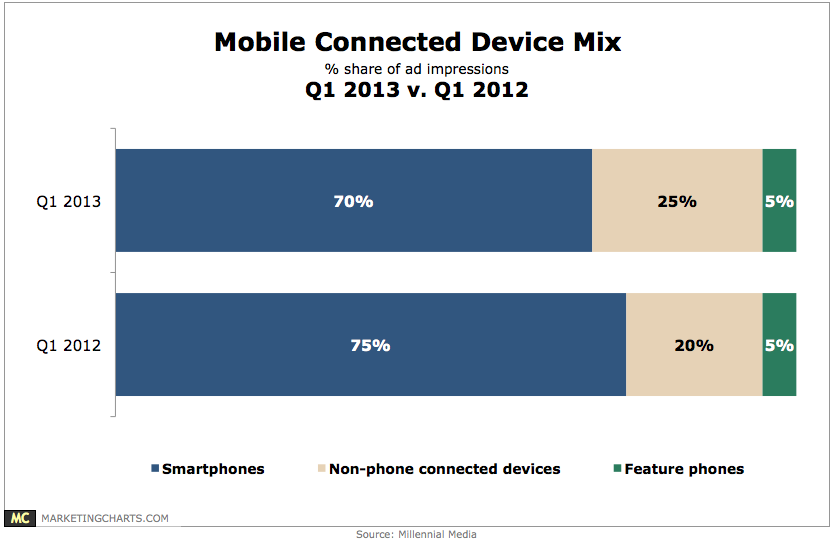
Non-phone connected devices accounted for 25% of total platform impressions, up from 20% a year earlier.
Read MoreSmart Device Users Worldwide By OS & Form Factor, February 2013 [CHART]
The vast majority of Android and iOS devices in use on the Flurry platform—and all Window devices—were medium phones.
Read More