Posts Tagged ‘Tablets’
Television Viewing Places By Device, June 2013 [TABLE]
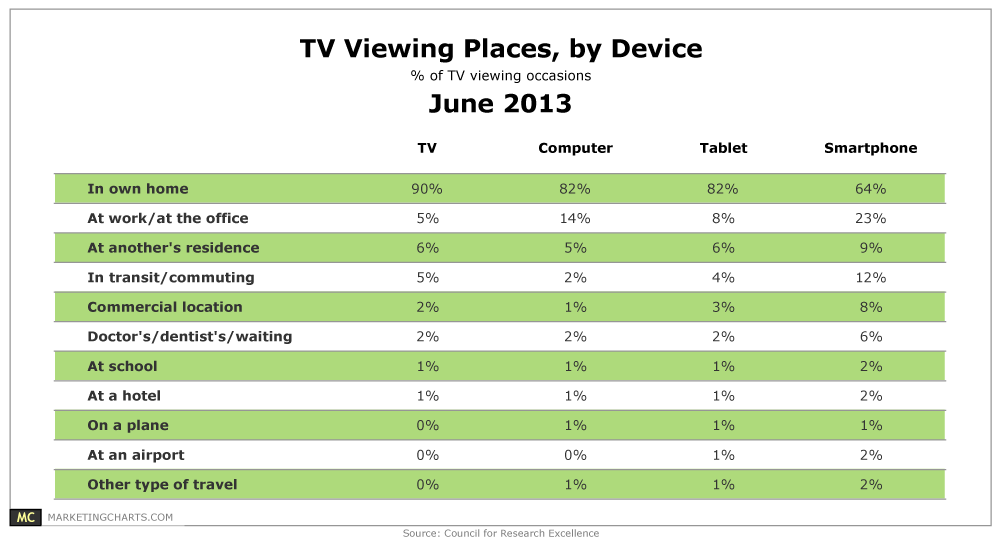
64% of smart phone TV viewing occasions occurred at home.
Read MorePreferred Television Genres By Viewing Device, June 2013 [CHART]
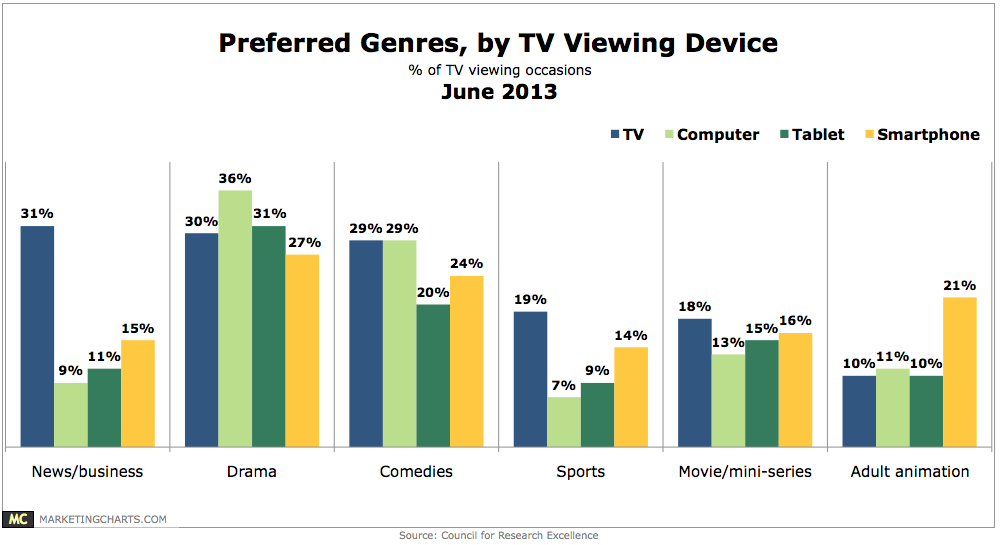
On the traditional TV, news and business (31%) got the edge on drama (30%) and comedies (29%) as the top genres by percentage of viewing occasions.
Read MoreTV Viewing Times By Device, June 2013 [TABLE]
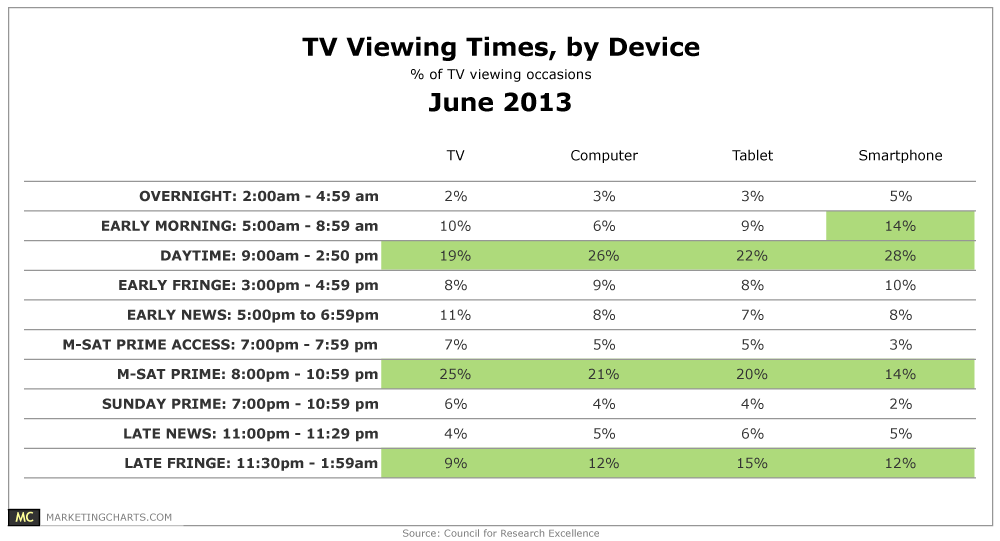
A plurality of tablet (22%) and smart phone (28%) TV viewing occasions tracked occurred during the daytime, between 9 AM and 3 PM.
Read MoreUS Print vs. iPad Magazine Ad Units, Q1 2012 & Q1 2013 [TABLE]
The number of ad units available on just the iPad increased nearly 24%, giving the iPad editions 56% of the total number of ad units as on print pages.
Read MoreTelevision Consumption By Device, June 2013 [CHART]
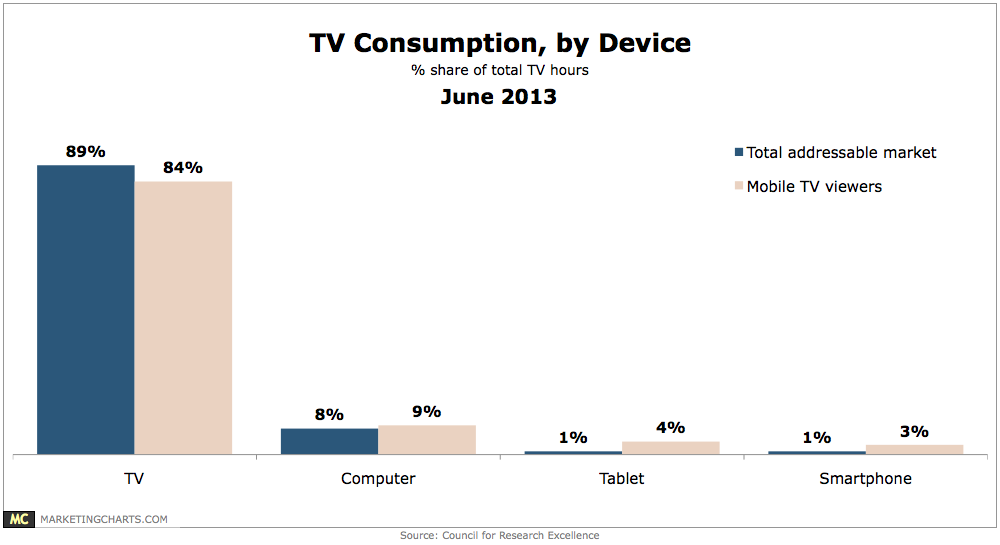
Just 2% of all TV hours logged were on tablets (1%) or smart phones (1%).
Read MoreMobile Users' Internet Access Preferences, May 2013 [CHART]
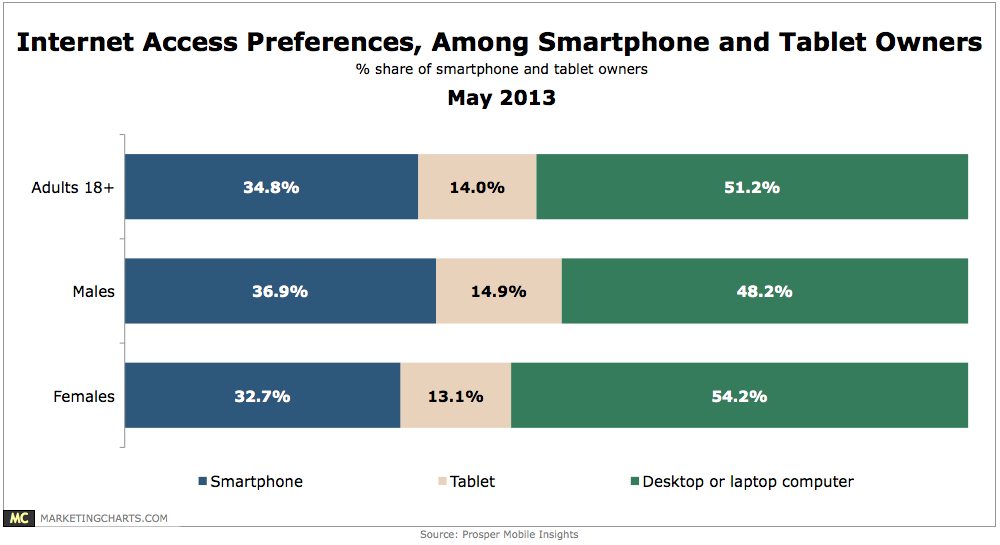
35% of mobile users prefer to access the internet via a smartphone and 14% via a tablet, meaning that only a bare majority still prefer to use their desktop or laptop computer.
Read MoreTop Mobile Devices By Ad Performance, Q1 2013 [TABLE]
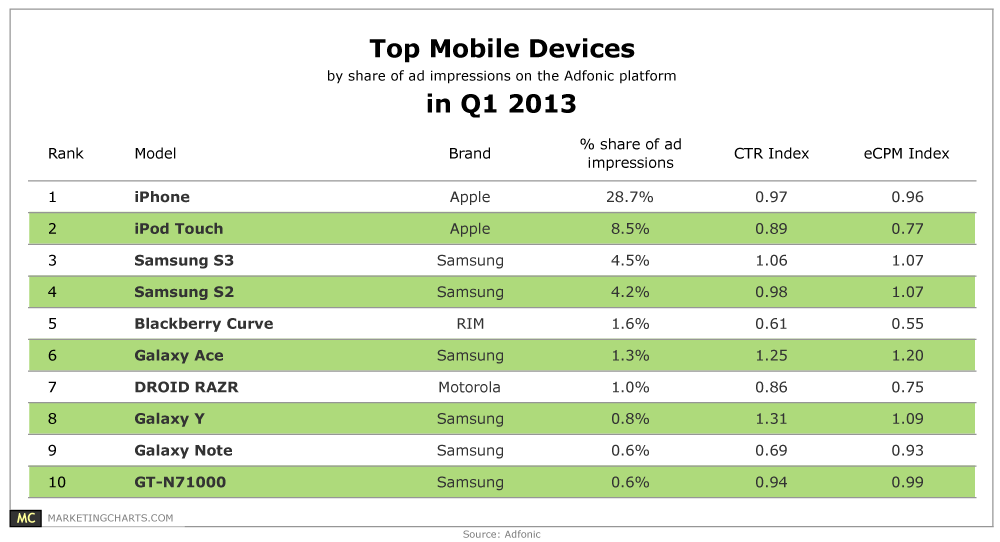
Samsung mobile devices on the whole sported higher click-through rates than the iPhone in the US and UK during Q1.
Read MoreImportance Of Mobile-Optimized Websites, May 2013 [TABLE]
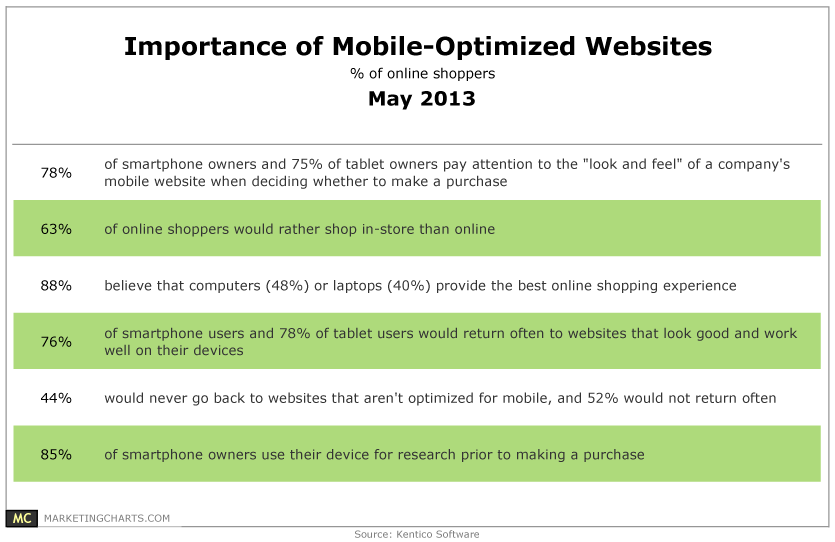
78% of smart phone owners and 75% of tablet owners consider the “look and feel” of a company’s mobile website when considering whether or not to make a purchase from it.
Read MoreDevices Used To Visit Social Media Sites By Gender, March 2013 [CHART]
The desktop and laptop remained the No. 1 place where users accessed sites, but the smart phone wasn’t far behind.
Read MoreMobile & Tablet Video Ad Views By OS, Q1 2013 [CHART]
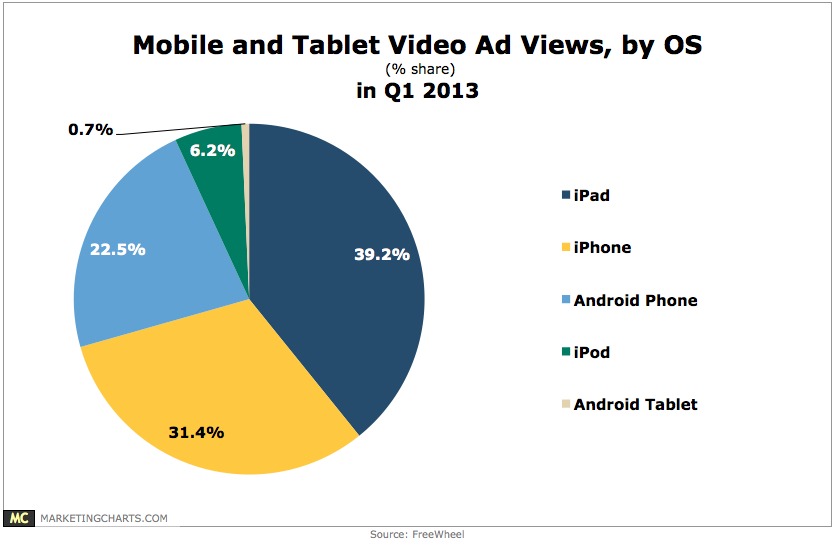
More mobile video ad views took place on an iPhone (31.4% share of mobile and tablet ad views) than an Android phone (22.5% share) in Q1.
Read More