Posts Tagged ‘Tablets’
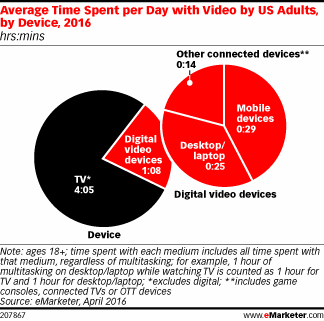
Average Daily Video Consumption By Device [CHART]
Even in a category as robust as digital video, though, growth has slowed and is expected to slow even more.
Read MoreMobile Commerce [INFOGRAPHIC]
This infographic illustrates the mCommerce market, from rising regions, to average order value, to mobile coupon use and payments.
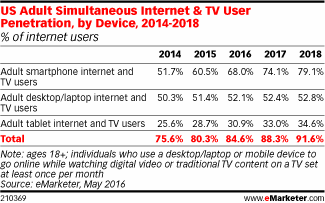
Read MoreSimultaneous Internet & TV Users, 2014-2018 [TABLE]
This year, 182.9 million Americans will use the internet while watching TV at least once a month.
Read MoreAmericans' Weekly Media Consumption By Race/Ethnicity [TABLE]
Americans’ Weekly Media Consumption By Race/Ethnicity [TABLE]Black adults watch almost three times more TV on a weekly basis than Asian-American adults.
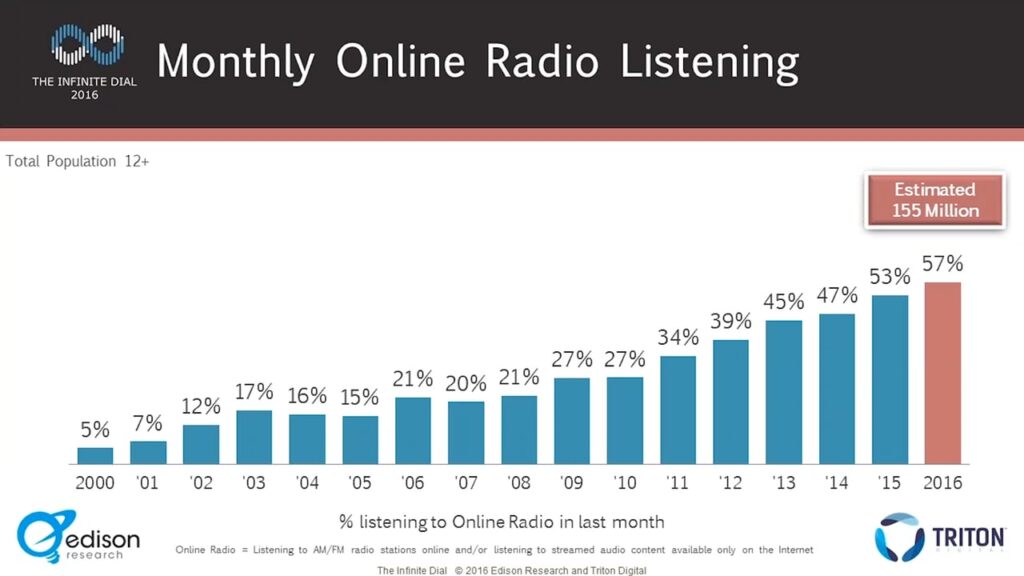
Read MoreAudio Media Consumption Behavior [WEBINAR]
Edison Research has released its latest annual Infinite Dial report that surveys the audio consumption habits of Americans 12 years and older. Edison has been conducting this research since 1998.
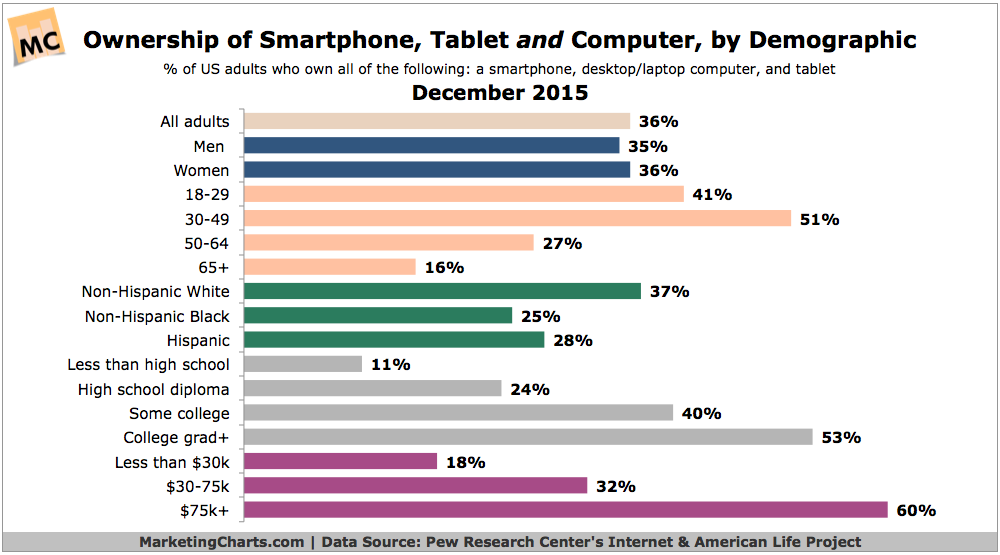
Read MoreSmartphone, Tablet & Computer Ownership By Demographics
Some 36% of US adults own a smartphone, computer and tablet.
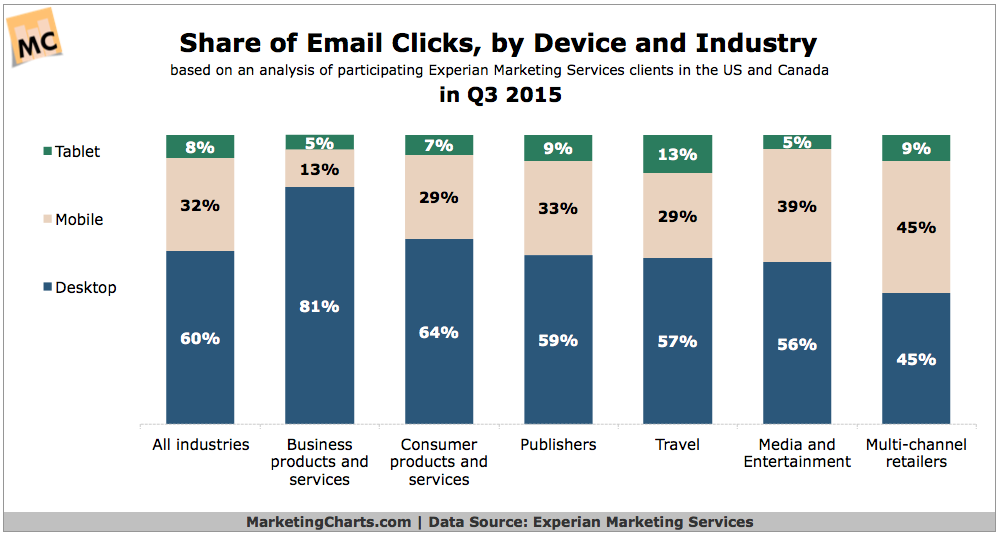
Read MoreShare Of Email Clicks By Industry & Device
Brands continue to increase their email volume, registering a 24.8% year-over-year rise in Q3.
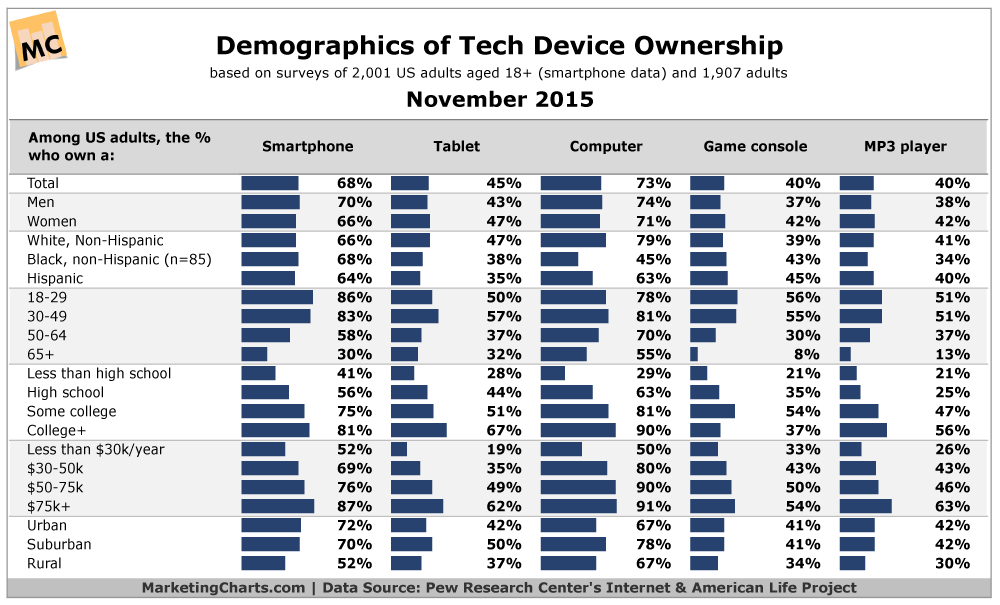
Read MoreTechnology Device Owner Demographics, November 2015 [CHART]
Slightly more than two-thirds of American adults (68%) now own a smartphone, representing a rapid rise from about half that proportion (35%) in mid-2011.
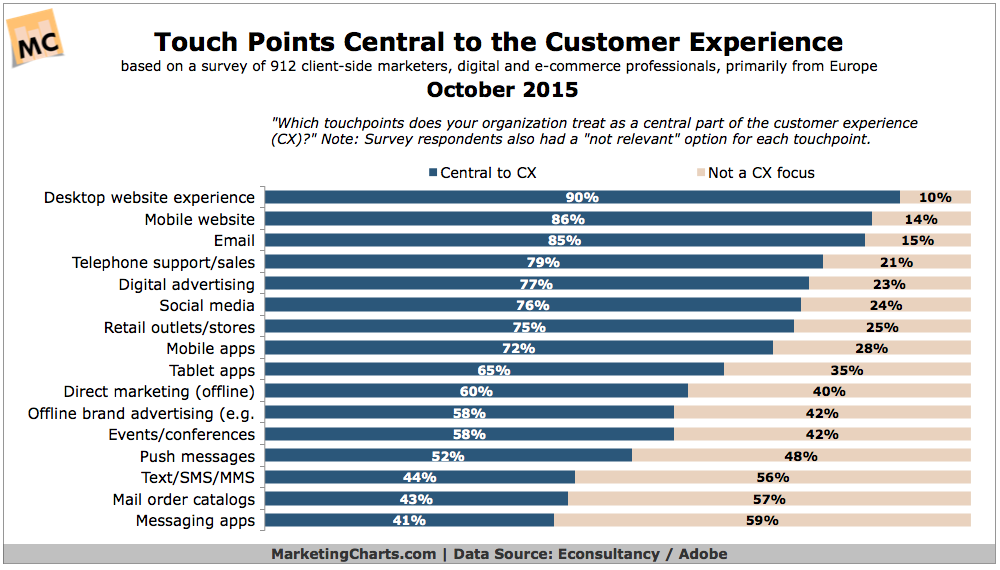
Read MoreMost Important Elements Of The Customer Experience, October 2015 [CHART]
The number of different touch points and complexity of the customer experience (CX) ranks as the greatest barrier preventing organizations from improving CX.
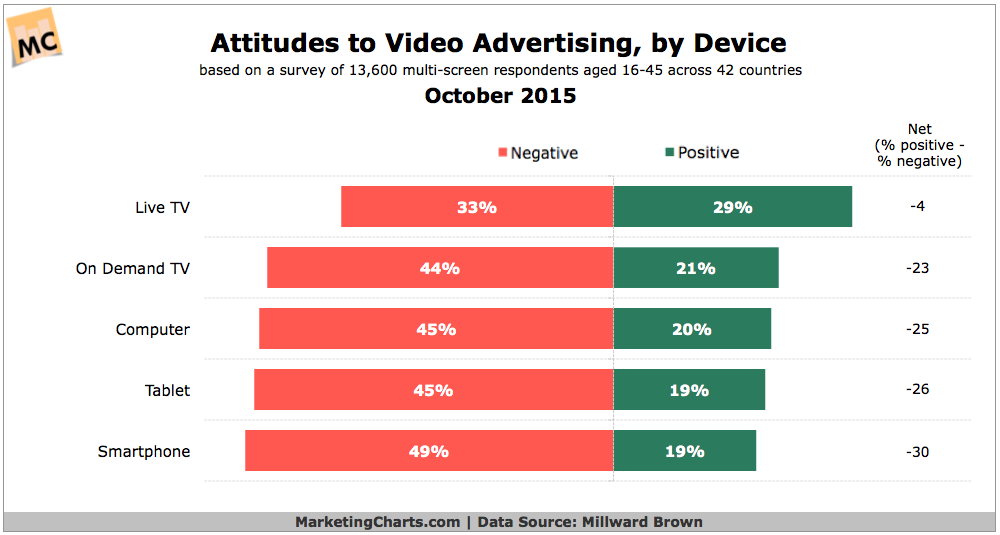
Read MoreAttitudes Toward Video Ads By Device, October 2015 [CHART]
TV’s share of multi-screen video viewing time might be challenged by digital screens, but viewers remain most receptive to ads on live TV.
Read More