Posts Tagged ‘Tablets’
Time Using Tablets By Activity, September 2013 [CHART]
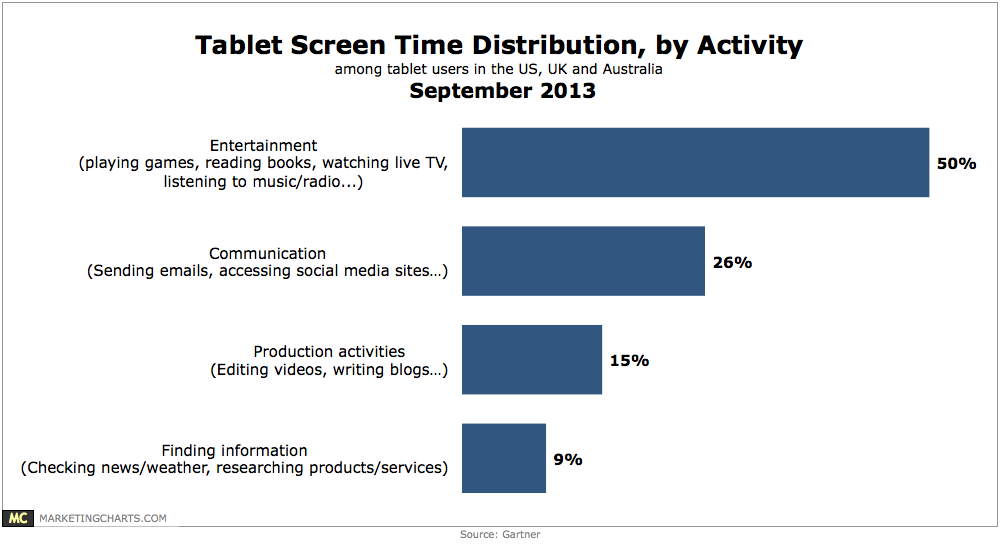
Tablet owners spend half of their device time with entertainment activities such as playing games, reading books, watching live TV or listening to music and radio.
Read MoreTime Spent Online By Platform & Content Type, April 2013 [TABLE]

Plenty of online content areas were still firmly rooted in PC use, with the desktop accounting for more than 60% of time spent accessing auto, business, TV, news and sports content.
Read MoreTime Spent Online By Platform & Demographic, April 2013 [CHART]
In April 2013, time spent accessing the web on smartphones and tablets surpassed time spent online on the PC by 2 percentage points.
Read MoreTechnographics Of Millennial Men, 2013 & 2017 [CHART]
Digital knowhow is important to young men. Gluttons for entertainment, young men consume much of it in digital form.
Read MoreUS Dual Tablet & Smart Phone Users, 2011-2017 [TABLE]
eMarketer estimates more than 73 million tablet users—57% of the US tablet-using population and 30% of US internet users—will also use a smartphone at least once per month this year.
Read MoreConnected Device Ownership Among Tablet Owners, April 2013 [CHART]
The vast majority of consumers who use tablets also own a host of other web-enabled devices.
Read MoreeCommerce Conversion Rates By Device, Q2 2012 – Q2 2013 [CHART]
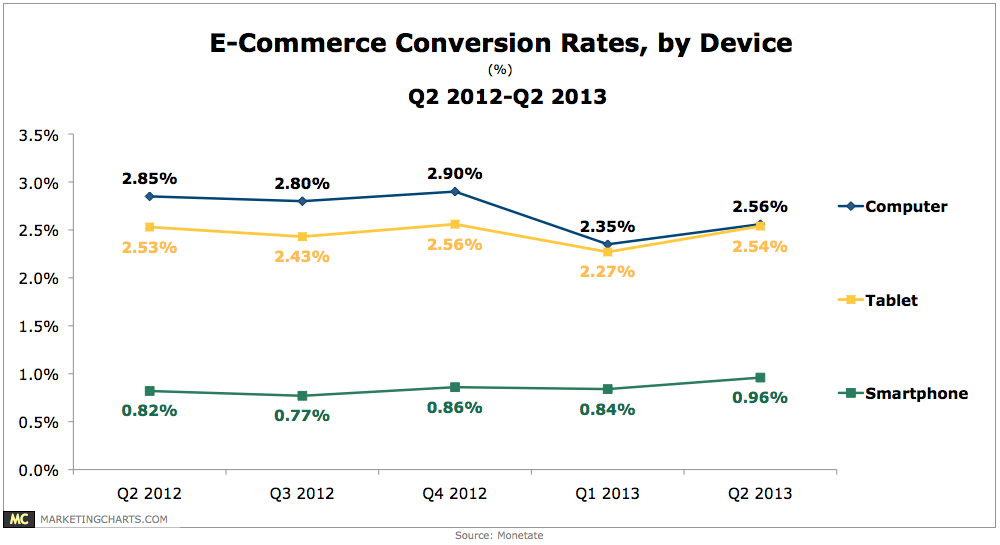
During the second quarter of the year, tablet traffic converted as well as traffic from traditional computers, while maintaining a similar average order value.
Read MoreVideo Engagement: Live vs On-Demand Video, Q2 2013 [CHART]
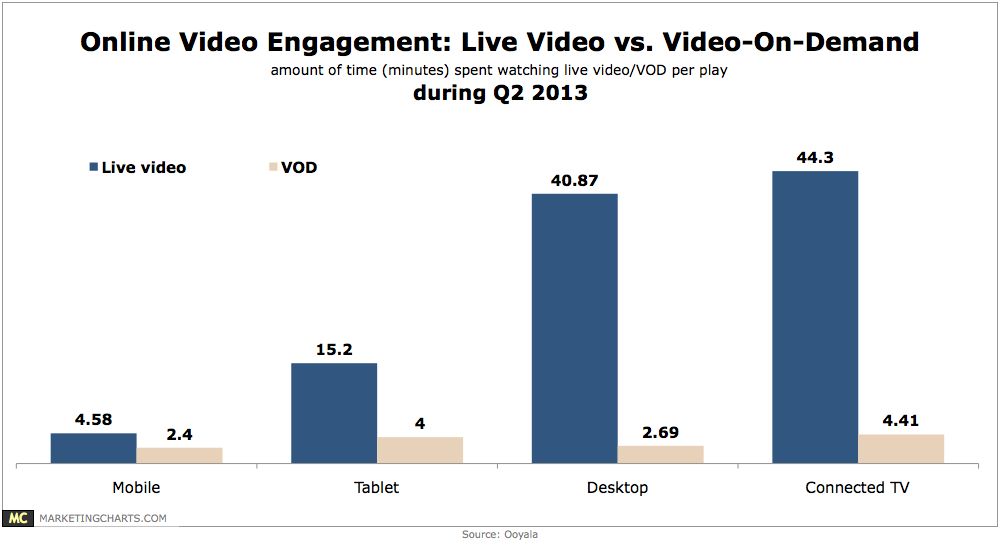
While tablet viewers spent nearly 4 times longer watching live video than on-demand during Q2, PC viewers spent about 15 times longer, and connected TV users 10 times longer.
Read MoreMobile Video Ad Views By OS, Q2 2013 [CHART]
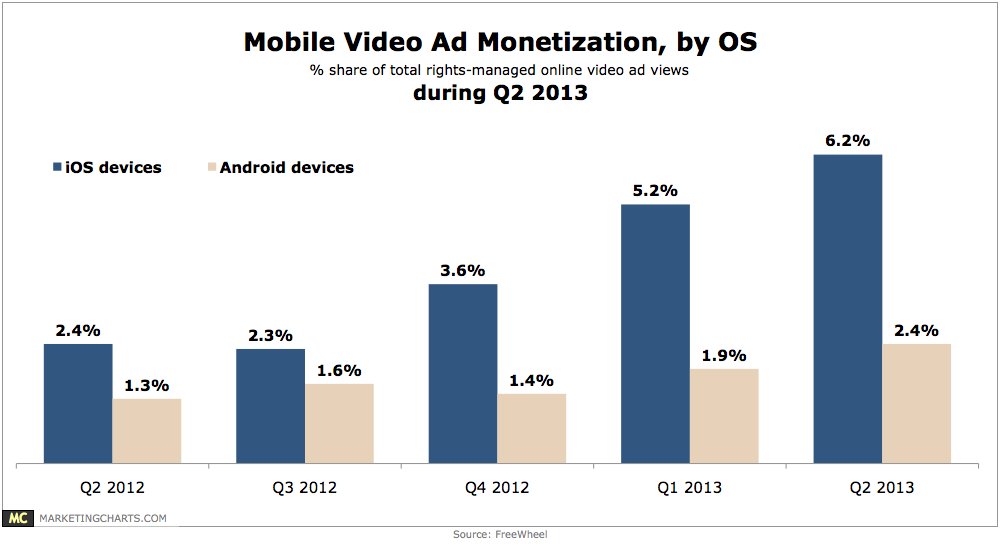
During the second quarter of the year, 17.5% of US rights-managed online video views occurred on a mobile phone (13.2%) or tablet (4.3%), almost double the 9.2% from Q2 2012.
Read MoreDevice Ownership By Income Level, September 2013 [CHART]
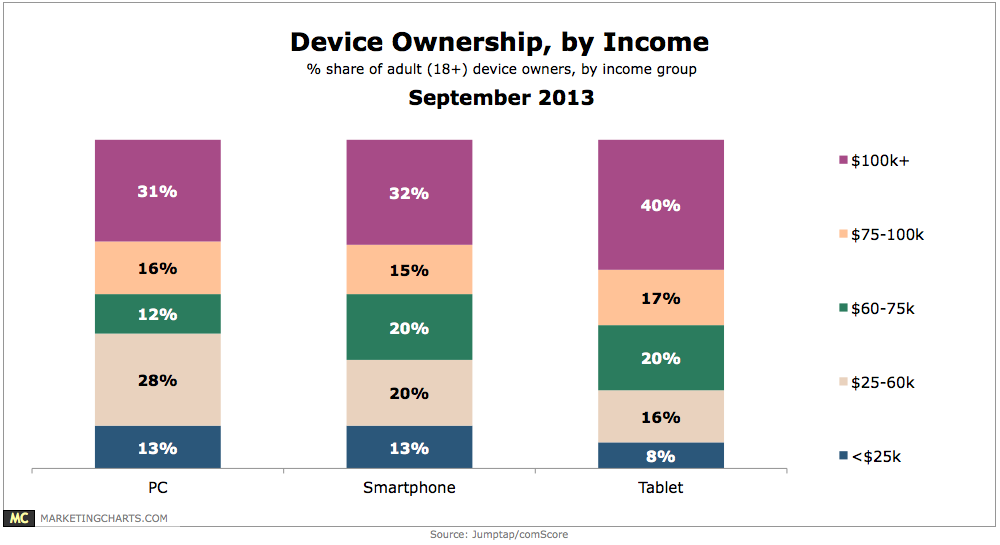
Tablet owners tend to have higher incomes than smart phone and PC owners.
Read More