Posts Tagged ‘Tablets’
Email-Driven Orders By Device, Q4 2013 [CHART]
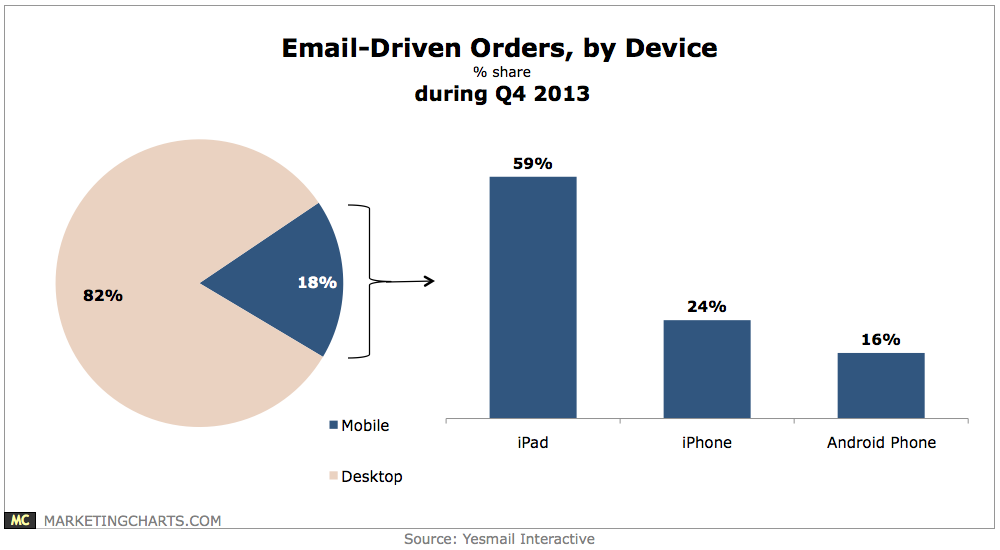
Some 18% of email-driven orders were completed on a mobile device during Q4 2013, up a couple of points from the preceding quarter.
Read MoreTop Brands For Customers' Emotional Engagement, February 2014 [TABLE]
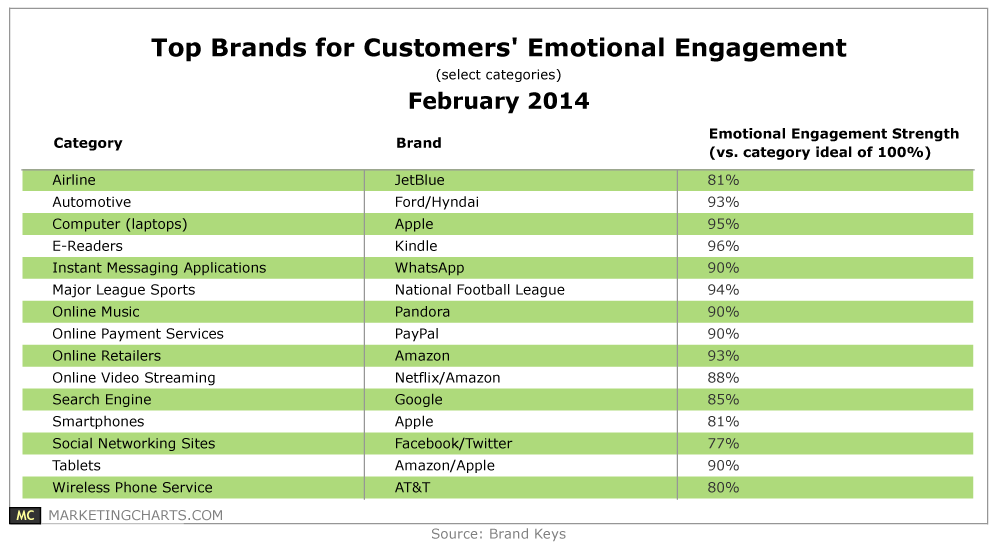
Consumers have never had higher emotional expectations from brands – but that brands’ ability to meet those expectations hasn’t grown as quickly.
Read MoreTwitter User Profile, February 2014 [TABLE]
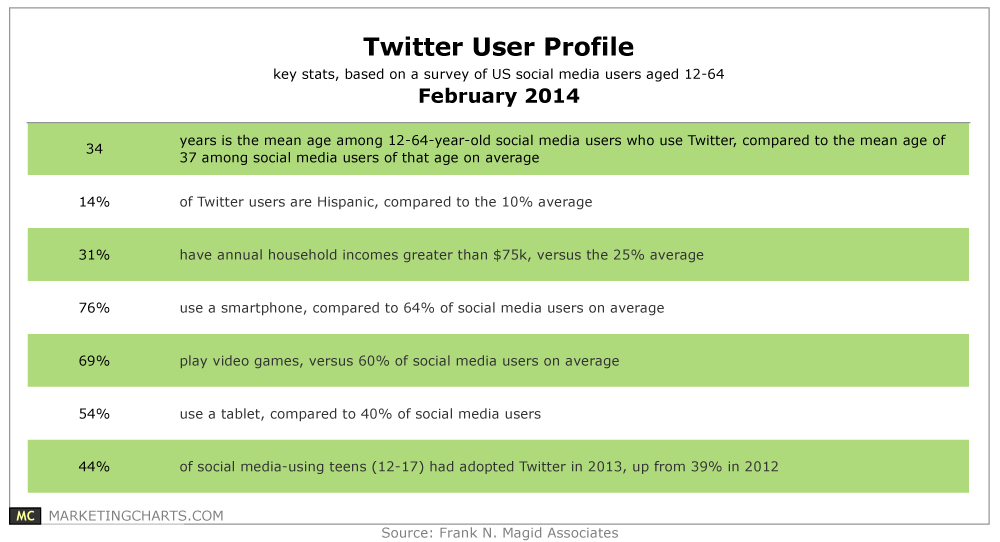
Twitter’s Q4 earnings report may have disappointed in terms of user growth, but recent survey data suggests that its existing users present attractive targets for marketers.
Read MoreClick Share Of US Product Listing Ads By Device, Q4 2012-Q4 2013 [CHART]
The most impressive growth for product listing ads was seen in mobile, which continued to grab click share from desktop.
Read MoreTop 10 Local US Markets By Tablet Penetration, November 2013 [CHART]
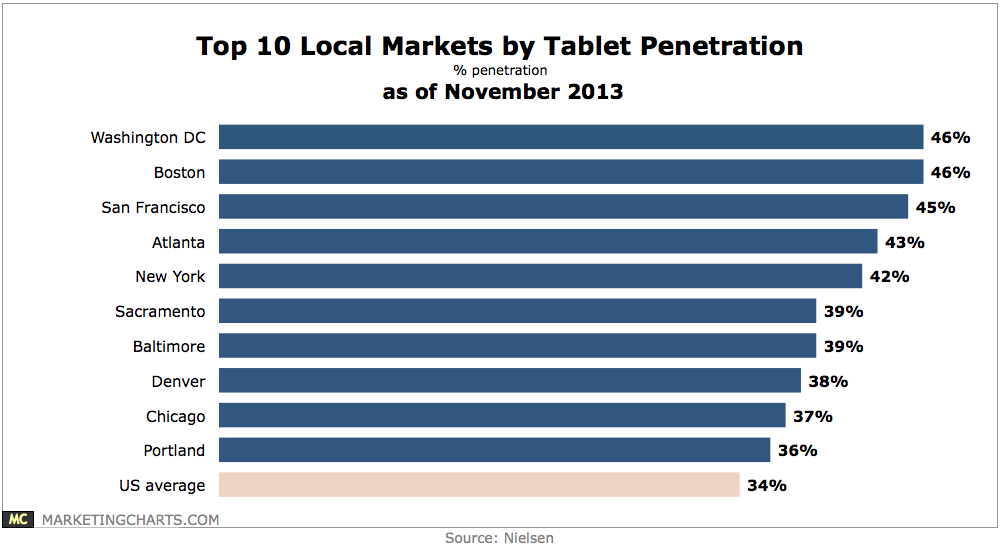
Nielsen looked at tablet penetration, with its 34% average across the US in November 2013 significantly below recent estimates of more than 40% penetration in December and January.
Read MoreDoctors' Informational Tasks By Device, August 2013 [TABLE]
The most common digital activity among US physicians in the survey was accessing the internet, at 97%.
Read MoreAmerican Tablet Adoption By Demographic As Of January 2014 [CHART]
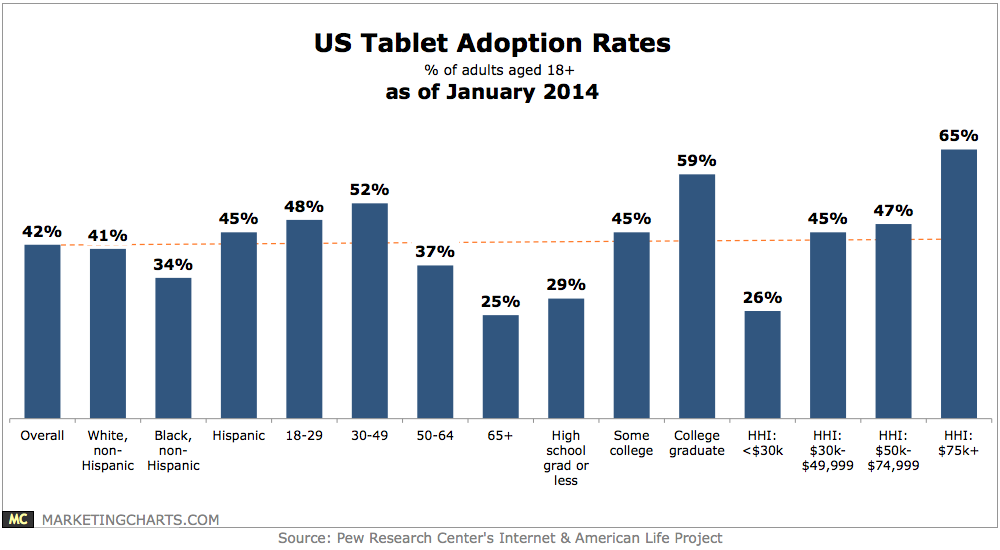
The 30-49 age group continues to have the highest tablet adoption rate – of 52% – although the 18-29 demo has closed the gap by virtue of its 48% penetration rate.
Read MoreAmerican Tablet Penetration, January 2014 [CHART]
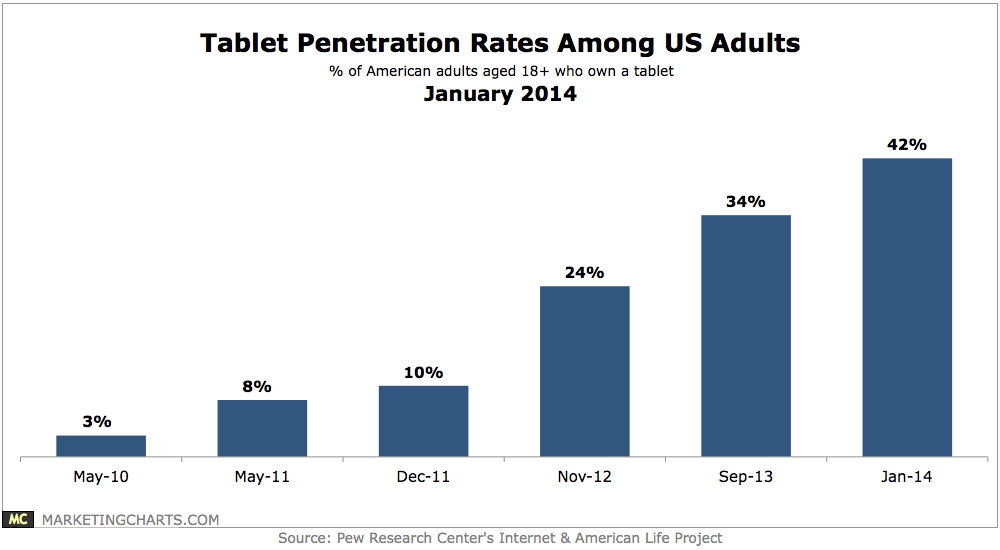
44% of US online consumers owned tablets as of December 2013, up 6 points from a year earlier.
Read MoreTablet Experience Preferences, January 2014 [CHART]
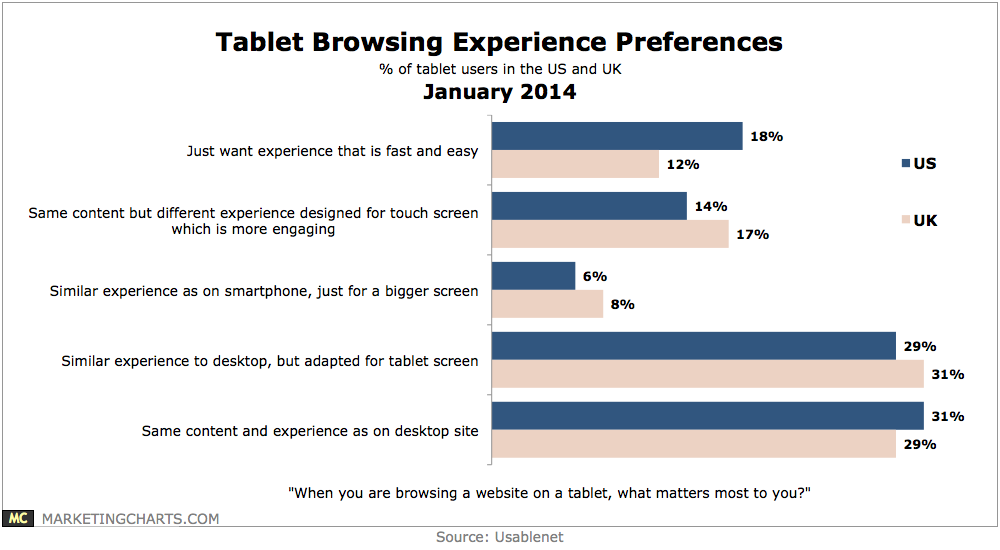
Fewer than 1 in 10 want an experience similar to the smartphone but on a bigger screen.
Read MoreDevices Used To Read eBooks, December 2011 vs January 2014 [CHART]
A preference for dedicated eReaders over tablets seems to be eroding among eBook readers.
Read More