Posts Tagged ‘South Korea’
Video Game Industry [INFOGRAPHIC]
This new infographic from Filmora illustrates the growth and potential of the video game industry.
Read MoreGlobal Consumer Data Privacy Concerns [CHART]
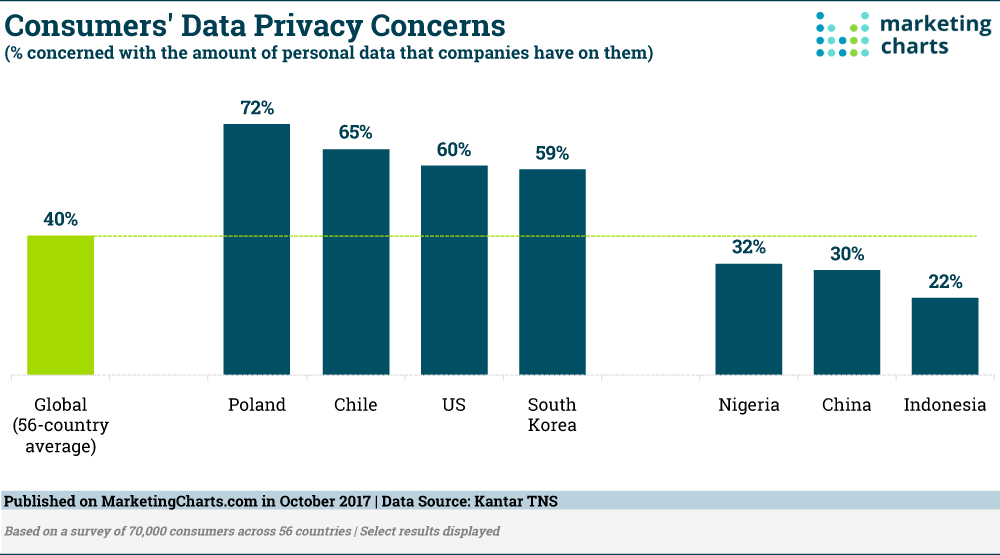
Four in 10 consumers around the world are concerned with the amount of personal data that companies have on them. Levels of concern vary widely across countries, with the US on the high end of the scale, with 6 in 10 concerned.
Read MoreMobile Commerce [INFOGRAPHIC]
This infographic illustrates the mCommerce market, from rising regions, to average order value, to mobile coupon use and payments.
Read MoreGlobal Average Ad Spending Per Capita In 2014 [CHART]
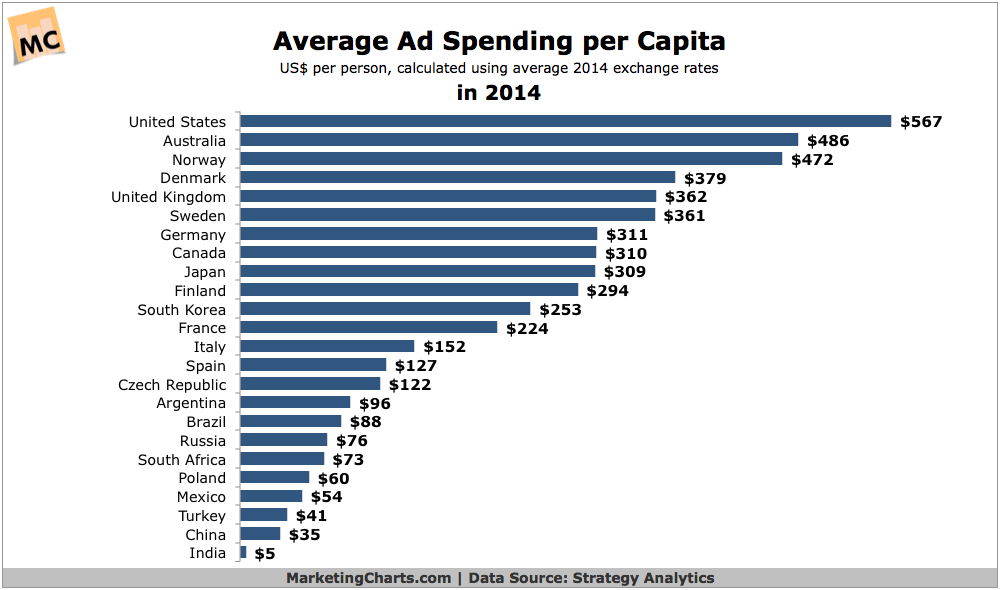
Marketers spent an average of $567 advertising to each person in the US last year, according to Strategy Analytics’ calculations.
Read MoreRetail eCommerce Sales As A Percent Of Total Sales By Country, 2013-2018 [TABLE]
China and the UK, have much higher proportions of online-to-total retail sales than the US, and ecommerce trends in each market are unique.
Read MoreTop 10 Countries By Retail eCommerce Sales, 2013-2018 [TABLE]
China and the US are by far the world’s leading ecommerce markets, combining for more than 55% of global internet retail sales in 2014.
Read MoreHow Quickly Do People Share Videos After Seeing Them? [INFOGRAPHIC]
INFOGRAPHIC: How Quickly Do People Share Videos After Seeing Them?
Read MoreFrequency Of Sharing Videos [INFOGRAPHIC]
Frequency Of Sharing Videos Infographic: Of the 17.9% who are sharing videos at least once a week, 8.6% are sharing daily.
Read MoreGlobal YouTube Video Views [INFOGRAPHIC]
Global YouTube Video Views Infographic: Less than 25% of video views worldwide are watched on YouTube.
Read MoreAdvertising Cost Per App Install By Country & OS, Q3 2014 [CHART]
For app advertisers, the cost per install (CPI) is significantly higher on iOS than Android devices.
Read More


