Posts Tagged ‘South Africa’
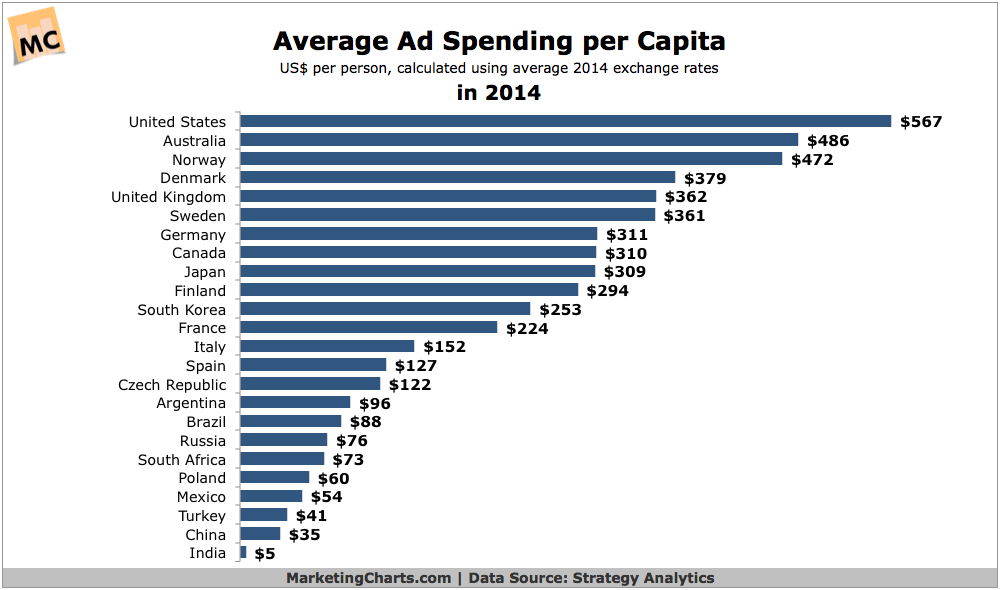
Global Average Ad Spending Per Capita In 2014 [CHART]
Marketers spent an average of $567 advertising to each person in the US last year, according to Strategy Analytics’ calculations.
Read MoreWhy Consumers Go Online, November 2014 [TABLE]
There are 4 primary reasons why consumers go online: interpersonal connections; self-expression; exploration; and convenience.
Read MoreSocial Channels Used To Follow Sports In Select Countries, February 2014 [TABLE]
Among US internet users who used social networks to follow sports, Facebook was the top platform used, cited by 70% of respondents—30 percentage points ahead of No. 2 YouTube.
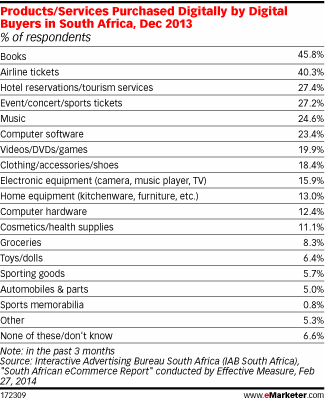
Read MoreProducts & Services South Africans Buy Online, December 2013 [TABLE]
Books and items related to travel and entertainment were the top products and services purchased online by digital buyers in South Africa.
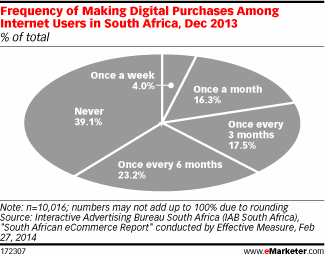
Read MoreFrequency With Which South Africans Make Online Purchases, December 2013 [CHART]
Digital buying wasn’t too frequent of an activity, with just 4.0% and 16.3% of internet users saying they did so once a week or month, respectively.
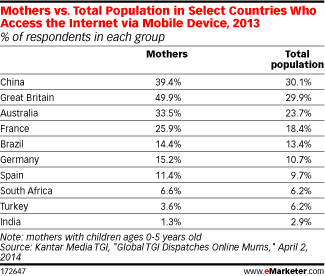
Read MoreMillennial Mobile Mothers In Select Countries, 2013 [TABLE]
49.9% of mothers in Great Britain with kids ages 0 to 5 accessed the internet via a mobile device in 2013, vs. just 29.9% of Great Britain’s total population.
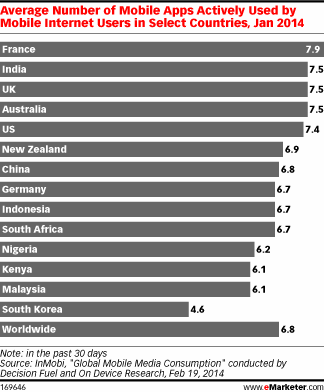
Read MoreAverage Number Of Mobile Apps Actively Used By Country, January 2014 [CHART]
The majority of non-voice mobile time is likely being spent with apps rather than the mobile web.
Read MoreMobile Web Users Primary Ways Of Surfing The Web, February 2014 [CHART]
6 in 10 mobile internet users from 14 key markets around the world say they typically go online to surf the web mostly (37%) or exclusively (23%) from their mobile phone.
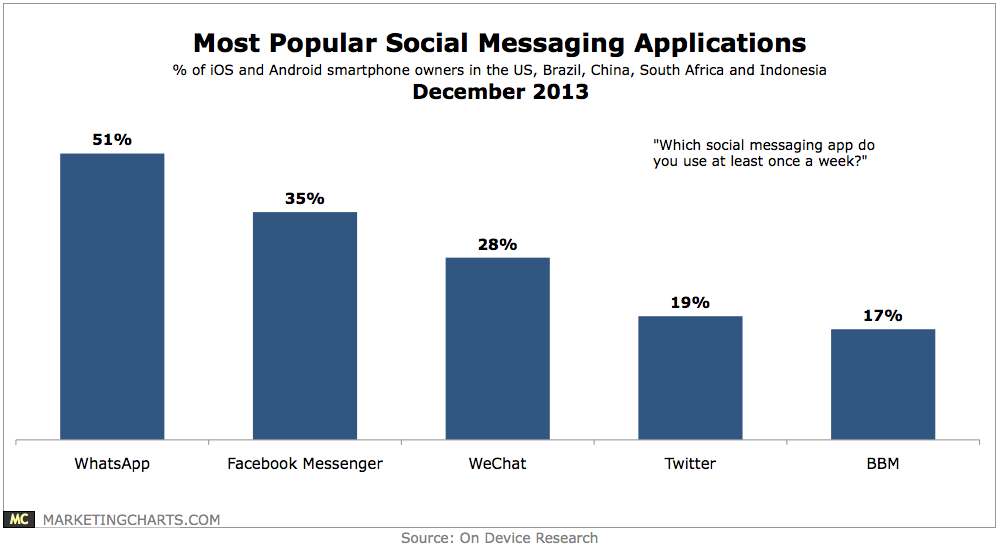
Read MoreMost Popular Social Messaging Apps, December 2013 [CHART]
Smartphone owners across 5 markets – the US, Brazil, China, South Africa and Indonesia – are more likely to be using social messaging applications on a daily basis than making voice calls, sending texts and emailing.
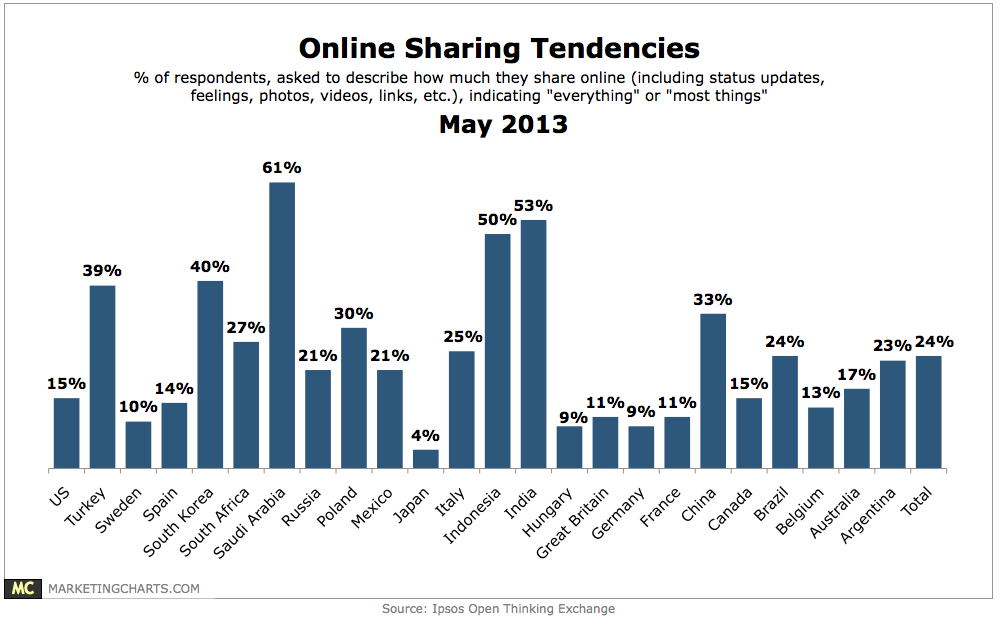
Read MoreGlobal Online Sharing Tendencies By Country, May 2013 [CHART]
Across the 24 countries tracked, an average of 24% said they’d best describe their amount of sharing as either most things or everything.
Read More