Posts Tagged ‘Smart Phones’
Devices Used To Connect To In-Flight Internet, December 2012 [CHART]
According to TripAdvisor’s annual air travel study, 37% of travelers considered their tablet an “essential” in-flight accessory—a 5% increase from the 2012 survey.
Read MoreAmericans' Use Of Mobile Devices On Vacation, March 2012 [CHART]
Approximately 98% took their mobile devices with them on vacation; nearly four in five respondents in this group used them “all the time.”
Read More
When Millennials First Grab Their Phones In The Morning, March 2013 [CHART]
Smart phones have so quickly embedded themselves in the lives of their users that 62% of all respondents said they reached for their device immediately after waking up, while 79% did so within 15 minutes of rising.
Read MoreMobile Commerce App Usage By OS, April 2013 [CHART]
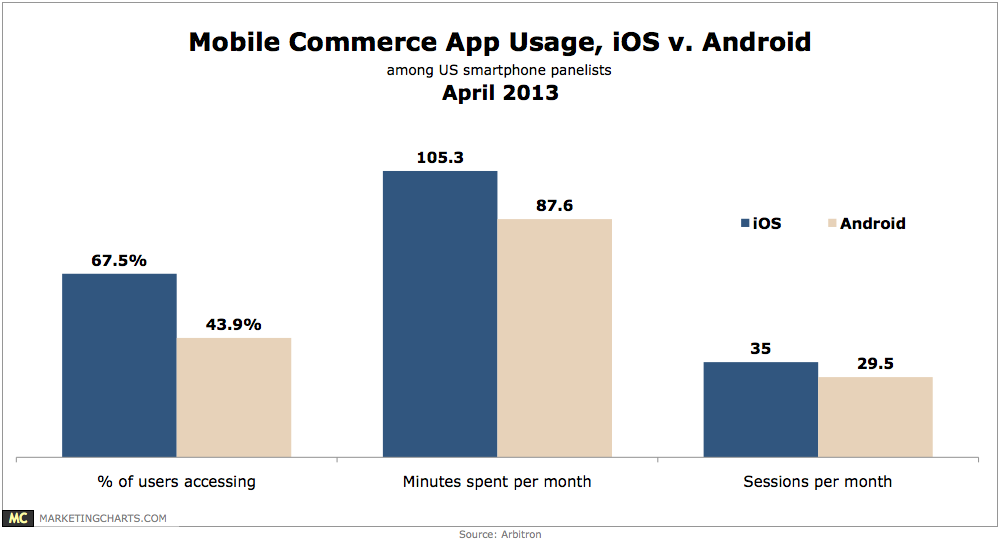
iPhone owners are 54% more likely than Android owners to use mobile applications for commerce.
Read MoreWeekly Time Spent Using IM/Chat Apps By Mobile OS, April 2013 [CHART]
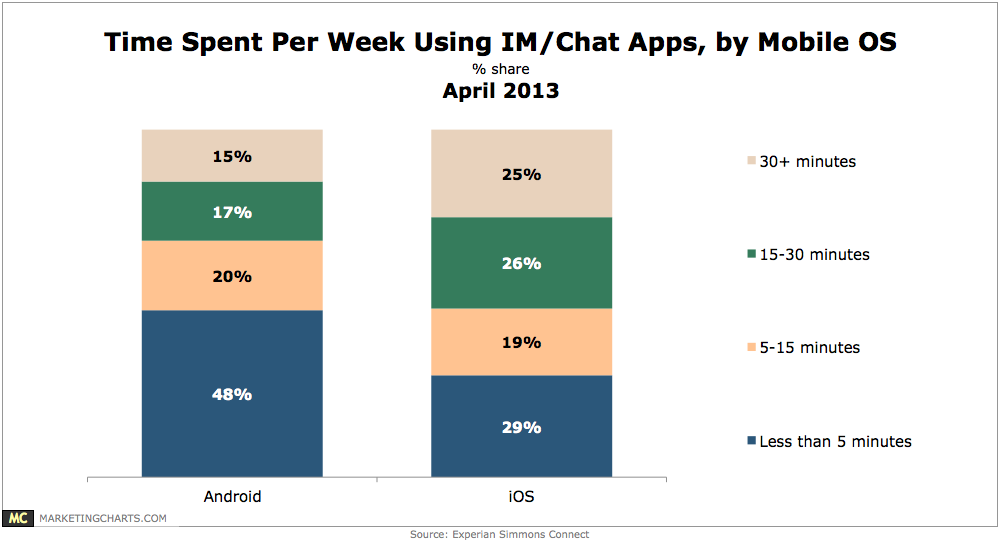
Android mobile owners are 2.4 times more likely than iPhone owners to use mobile IM/chat applications such as Whatsapp and Kik Messenger, but iPhone owners are heavier users of the apps.
Read MoreHow American Women Research Products, March 2013 [CHART]
Only 6% of American women reported still researching products primarily in-store, while another 5% asked friends and family for recommendations most often.
Read MoreSecond Screen TV-Related Behavior, April 2013 [CHART]
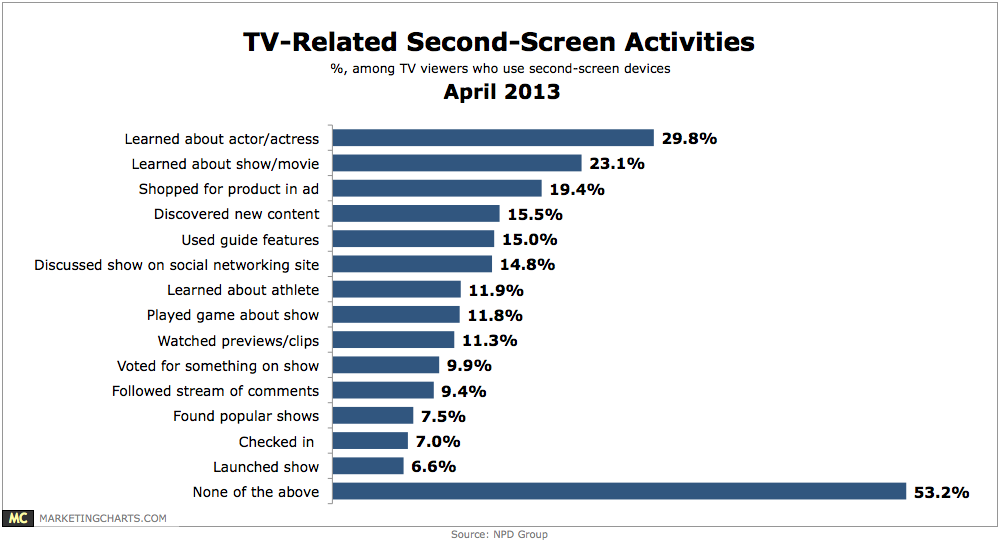
Among the most common is shopping for a product seen in an ad, by 19.4% of TV watchers who engage in second-screen activities.
Read MoreMobile Share Of Search Traffic, Q1 2013 [CHART]
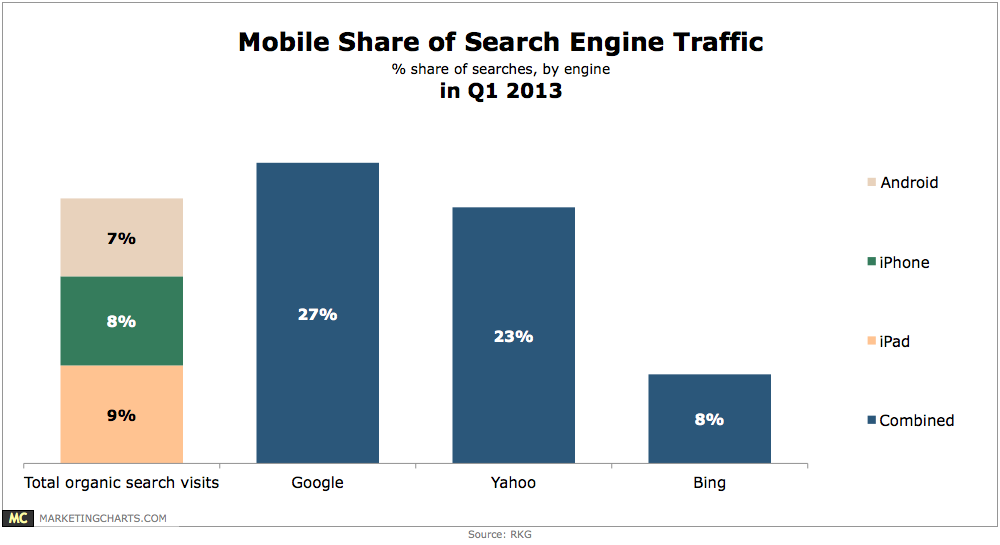
Tablets and smart phones combined accounted for roughly 24% of organic search visits in Q1.
Read MoreBroadcast TV Content Completion Rates Online By Device, 2012 [CHART]
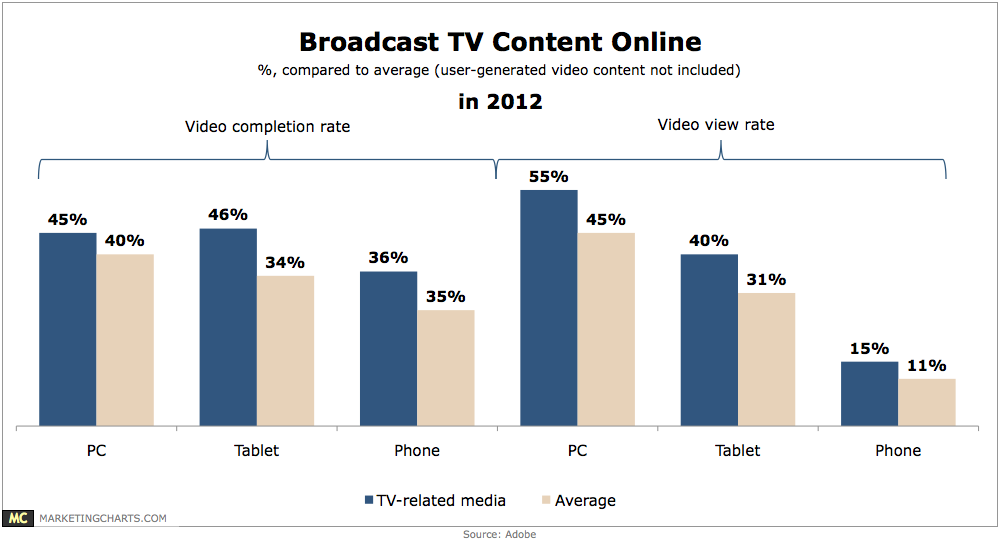
Compared to the average, completion rates for TV-related content (such as full episodes of TV shows) are 12.5% higher on PCs (45% vs. 40%), 31.4% higher on tablets (46% vs. 35%), and 33.3% higher on mobile phones (36% vs. 27%).
Read More