Posts Tagged ‘Smart Phones’
Change In Facebook Users' Activities By Device, Q1 2013 [TABLE]
Watching videos on Facebook saw among the biggest jumps in usage, with viewing increasing by 47% on both PC and mobile, and nearly doubling on the tablet.
Read MoreHow People Watch TV, May 2013 [CHART]

An average of just 44% of viewing of full-length TV shows is live.
Read MoreSecurity Measures Not Taken By Smart Phone Owners, May 2013 [TABLE]
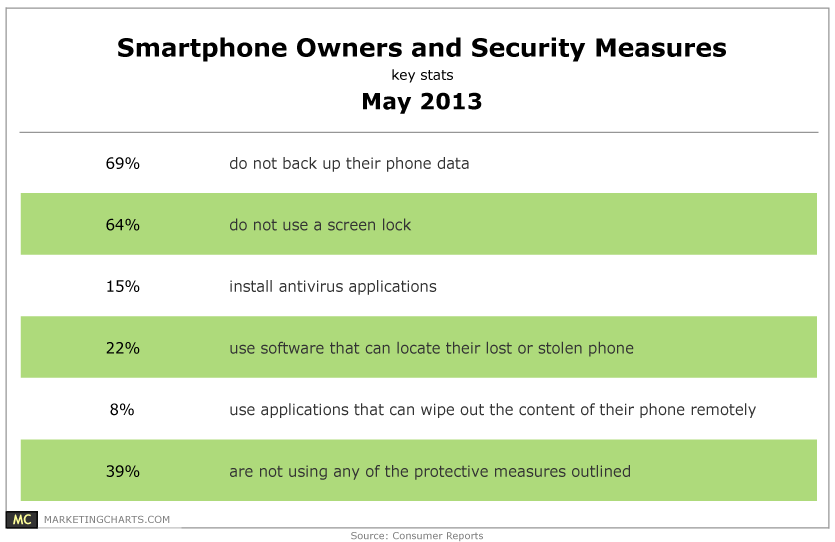
Only 22% of smart phone users have installed an application to locate a missing phone.
Read MoreMobile Devices & Local Content, May 2013 [TABLE]
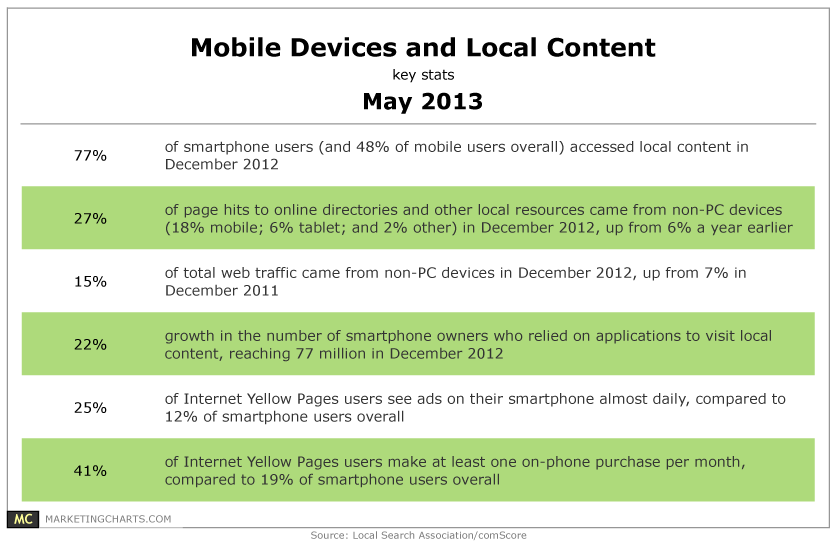
48% of mobile phone users accessed local content in December 2012, up from 42% a year earlier.
Read MoreSmart Phone Penetration, October 2011 – March 2013 [CHART]
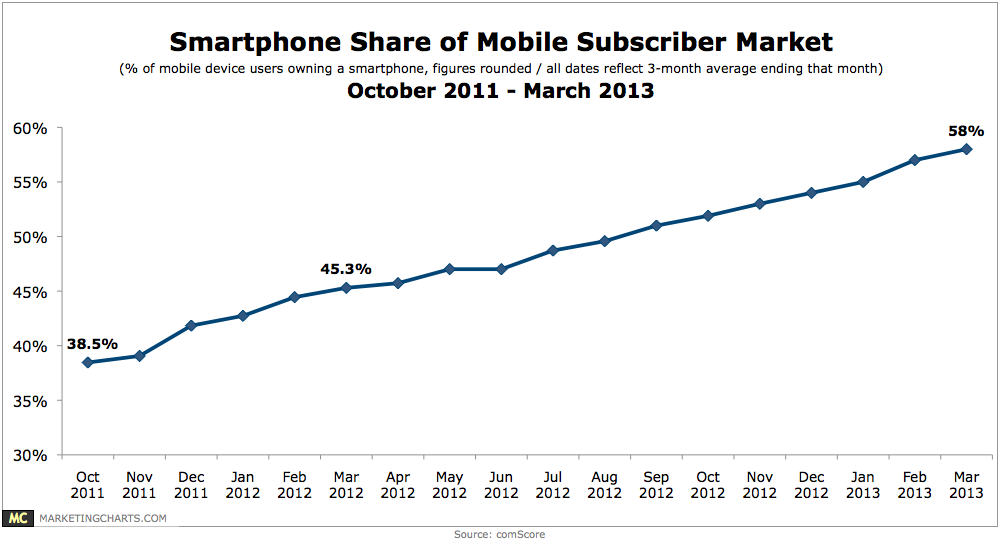
During the 3-month period ending in March, smart phone penetration reached 58% of the mobile market, up a percentage point from the prior month and almost 30% year-over-year.
Read MoreDemographics Of Online Video Viewers By Video Type, May 2013 [TABLE]
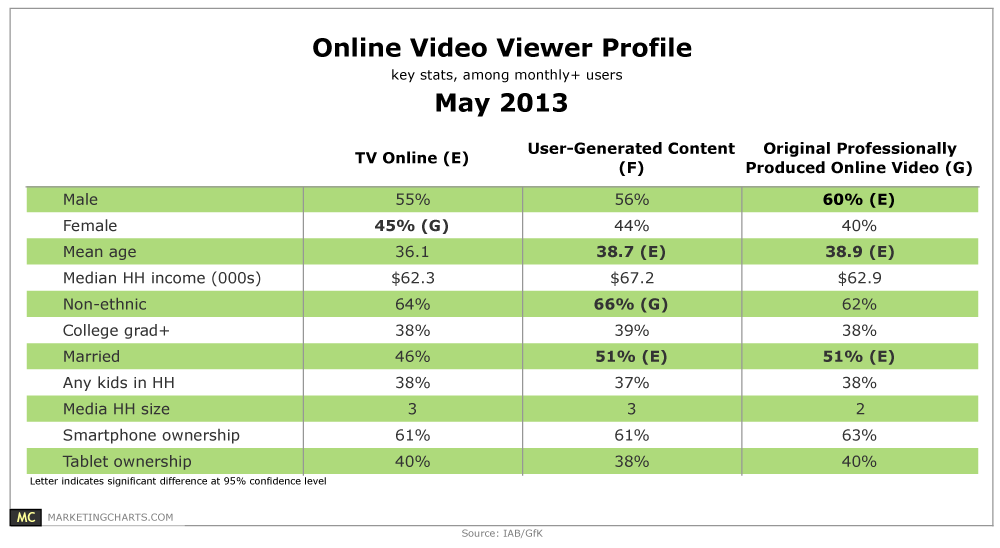
1 in 5 or more American adults watch a TV show online (23%), user-generated content (UGC – 31%), or originally produced online video (OPOV – 19%) on at least a monthly basis.
Read MoreMost Popular Gaming Devices Of Tablet Owners, May 2013 [CHART]
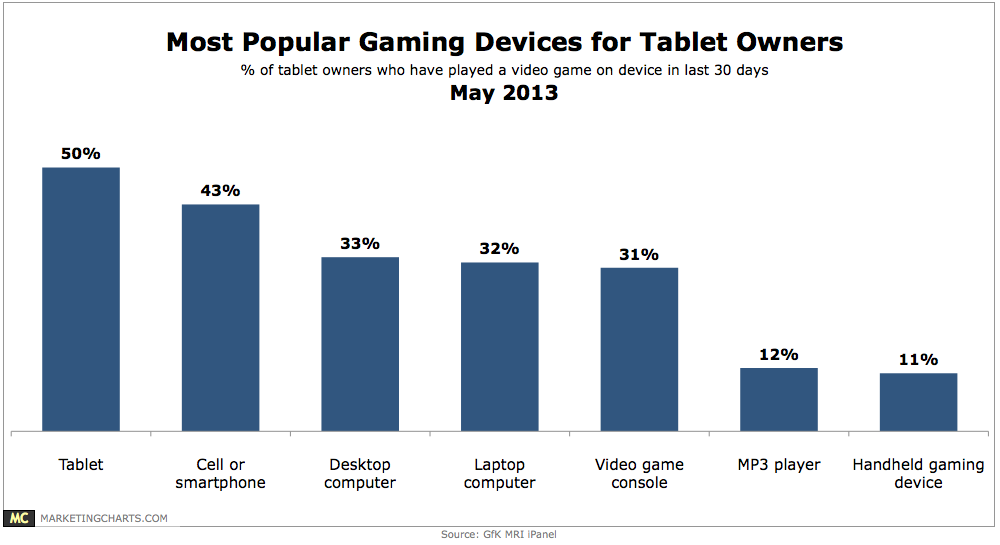
50% of tablet owners played a video game on their device in the past 30 days.
Read MoreAverage US Search CPC By Device, Q1 2013 [TABLE]
The computer still garnered the highest CPC rates in the US, at 56 cents in Q1 2013, while the phone was a comparatively inexpensive 30 cents per click.
Read MoreUS Search Ad Spending vs. Clicks By Device, Q1 2013 [CHART]
In Q1 2013, the tablet and phone accounted for nearly 20% of paid search clicks, but the devices only garnered about 14% of search spending.
Read MoreGlobal Share of Mobile Real-Time Bidding Ad Views By OS, Q1 2013 [CHART]
In-app advertising accounted for the bulk of mobile RTB ads, at 93% of ads viewed. Browsers accounted for the remaining 7%.
Read More