Posts Tagged ‘Smart Phones’
Smart Phone Owners Mobile Transaction Experiences, November 2013 [CHART]
Some 46% smart phone owners say they have either used or seen someone firsthand use a mobile application that allows the redemption of offers at a retailer or restaurant, up from 40% last year.
Read MoreUS Teen Smart Phone vs Tablet Users By Demographic, 2012 & 2013 [TABLE]
Both smart phone and tablet use saw a large leap among US teenagers ages 13 to 17 between 2012 and 2013.
Read MoreDesktop vs. Mobile Email-Driven Purchases, Q3 2013 [CHART]
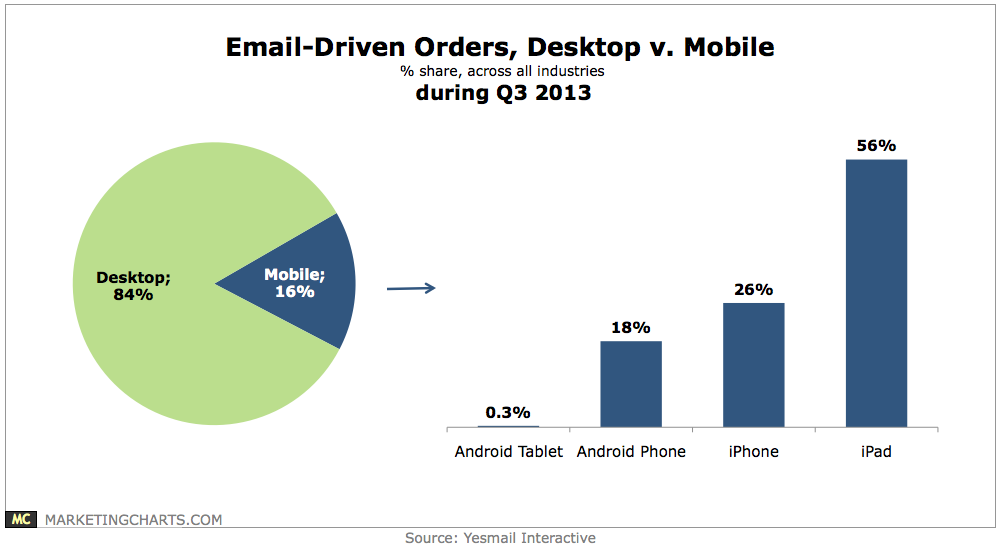
Mobile devices accounted for 15% of revenues generated through email across 12 tracked industries in Q3.
Read MoreTime Spent On Sports Sites By Device Type, June 2010 & June 2013 [CHART]
US sports leagues and broadcasters are streaming increasing amounts of content on their broadband and mobile channels.
Read MoreShare Of Mobile Purchases Generated From Marketing Emails By Device, Q3 2013 [CHART]
Most of the orders placed on mobile devices happened on tablets—and more than 99% of tablet purchases occurred on the iPad.
Read MoreMobile App Engagement, November 2013 [CHART]
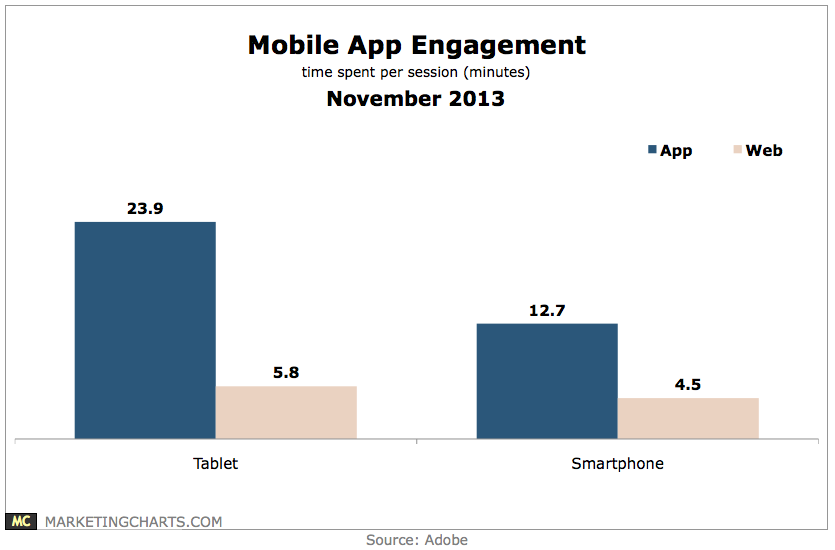
Tablet users spent on average 24 minutes per app session, about 4 times longer than their typical website visit.
Read MoreSmart Phone Share Of US Mobile Market, October 2011 – September 2013 [CHART]
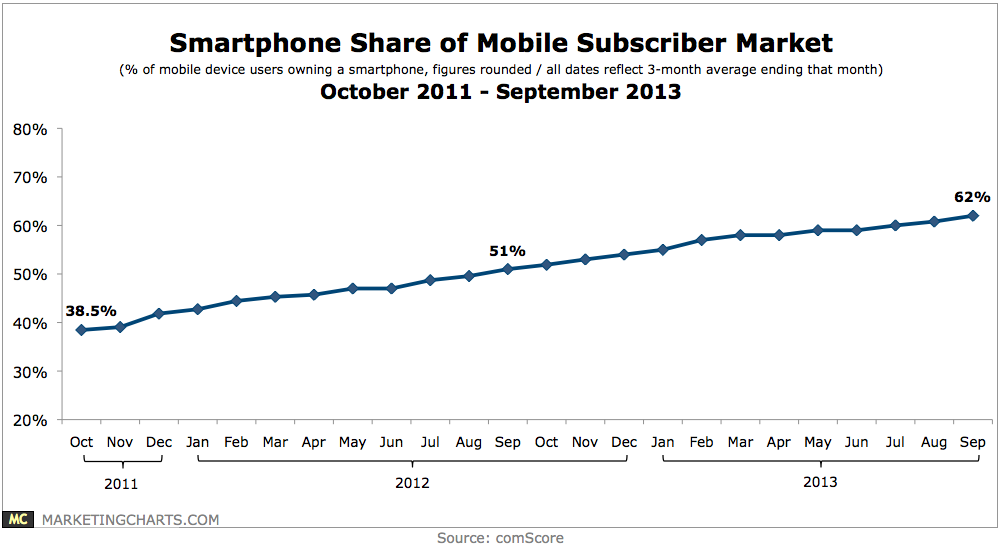
Smartphone penetration reached 62% of the US mobile subscriber market during the 3-month average ending in September (Q3).
Read MoreHow Internet Users Look For Deals By Income, March 2013 [TABLE]
90% who earned $100,000 to $199,999 “almost always” conducted research for deals and best prices before shopping.
Read MoreImportance Of Screens As Advertising Vehicles, 2013 vs 2016 [CHART]
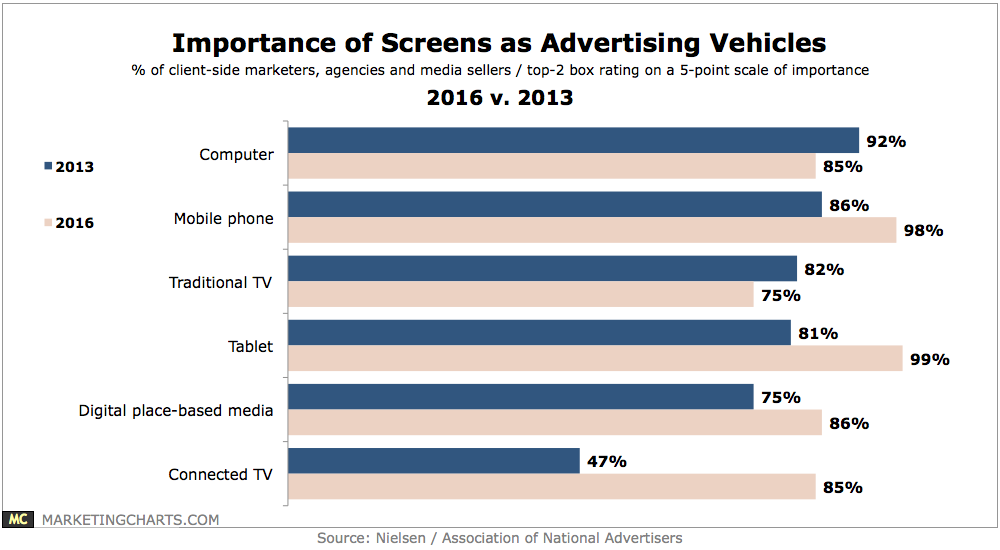
In 3 years’ time, mobile phones and tablets will be more important advertising screens than the traditional TV.
Read MoreMobile WiFi Users Preferred Device & Method To Research & Purchase Retail Products [CHART]
Just 14% of shoppers preferred to research in-store, with the rest using laptops and mobile devices.
Read More