Posts Tagged ‘Smart Phones’
Average Daily Time Spent Playing Mobile Games By Gender, October 2013 [TABLE]
More than three-quarters of time US internet users spent with such content was on mobile, with desktop claiming just 22%.
Read MoreReasons US Smart Phone Owners Play Mobile Games By Gender, October 2013 [VIDEO]
Half of US smart phone owners cited stress relief as their reason for playing smart phone games, the No. 1 response.
Read MoreTechnographic Generational Gap By Device, January 2014 [TABLE]
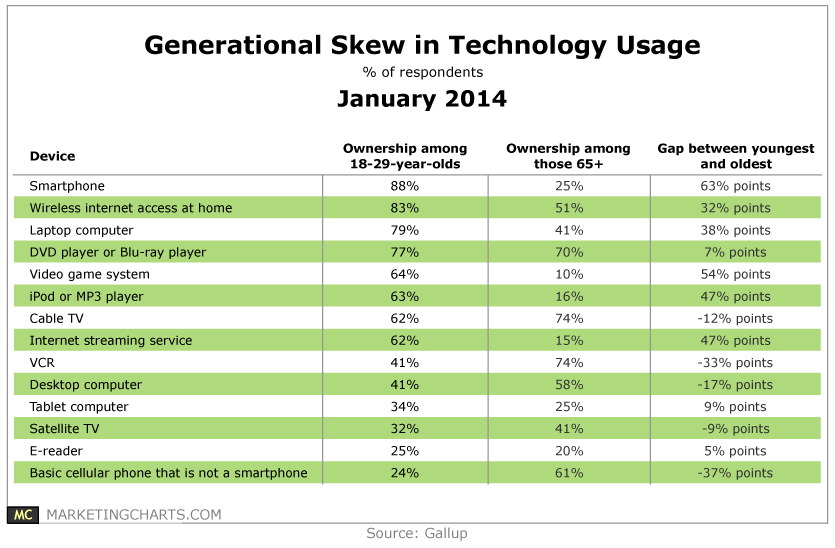
Gallup measured the penetration rates of 14 consumer electronic devices among 18-29-year-olds and those aged 65 and up.
Read MoreHoliday Purchases via Retailer's Mobile App, January 2014 [CHART]

Roughly one-third of respondents – each of whom own a smartphone, and 65% of whom own a tablet – claimed to have made a holiday gift purchase using a retailer-branded application on a smartphone or tablet during the season.
Read MoreConsumer Electronics Owned By Americans, January 2014 [TABLE]
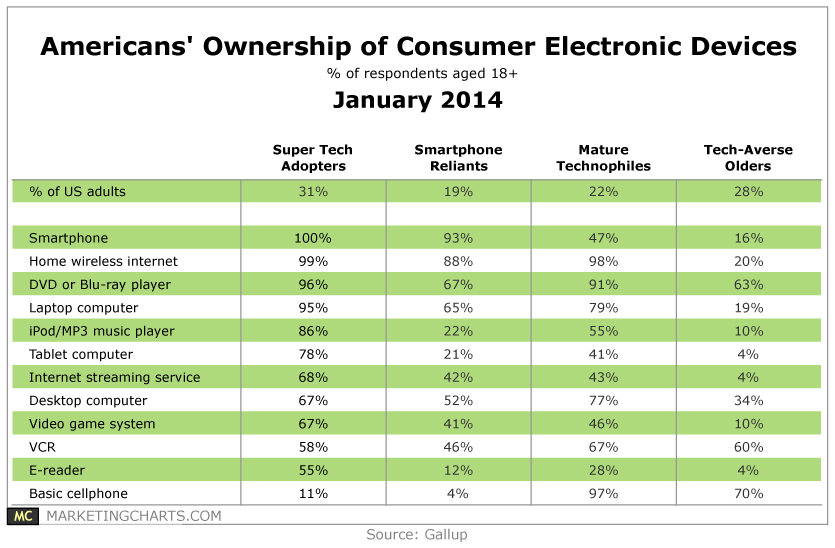
Of the 12 consumer electronics devices identified, 9 see penetration rates of 67% or higher among Super Tech Adopters.
Read MoreUS Mobile Search Advertising Growth By Device, Q4 2013 [CHART]
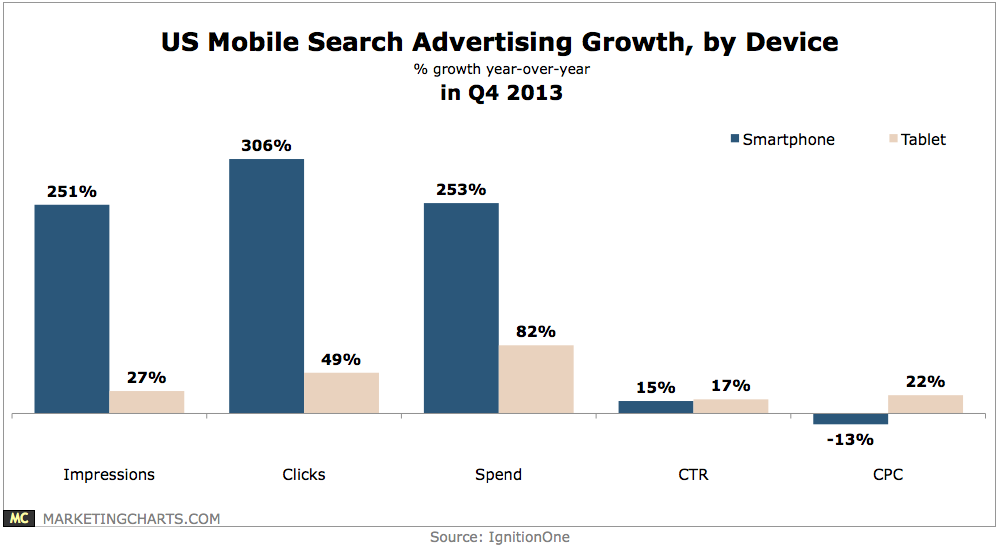
Search ad spending on smartphones soared by 253% year-over-year, while spending on tablets grew by a relatively smaller 82%, as advertisers’ targeting options were limited by Enhanced Campaigns.
Read MoreHow Customers Interact With Top Retailers, January 2014 [CHART]
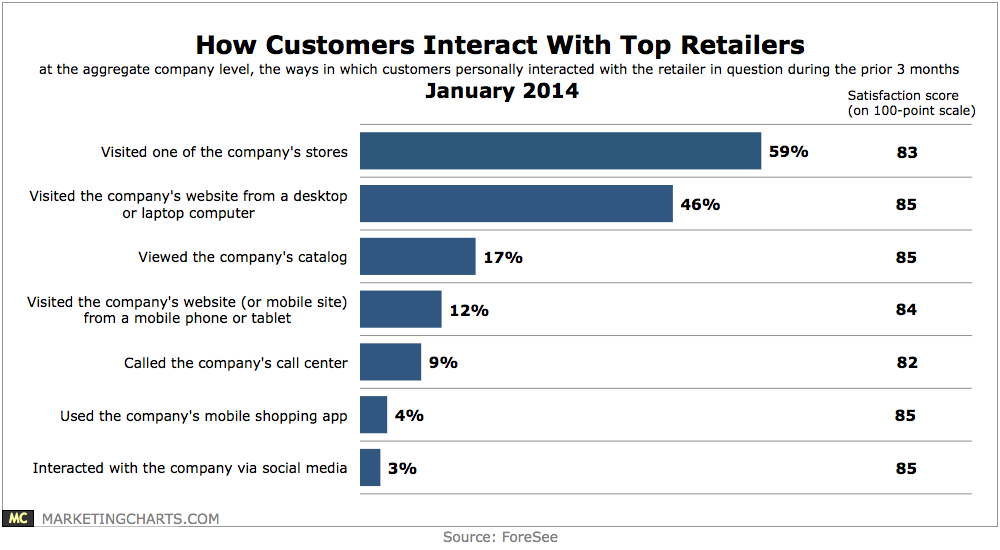
Consumers were more likely to have viewed a company’s catalog (17%) than to have interacted with the company via social media (3%).
Read MoreTV Viewing Via Cable Provider's App Or Website, January 2014 [CHART]
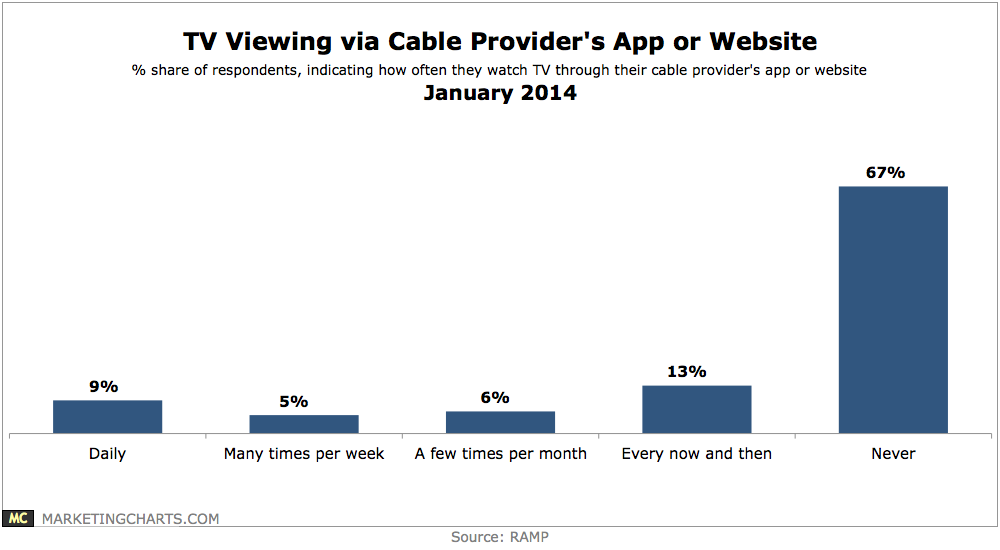
Some 80% of respondents are unaware of TV Everywhere.
Read MoreTop 10 Smart Phone Properties, November 2013 [CHART]
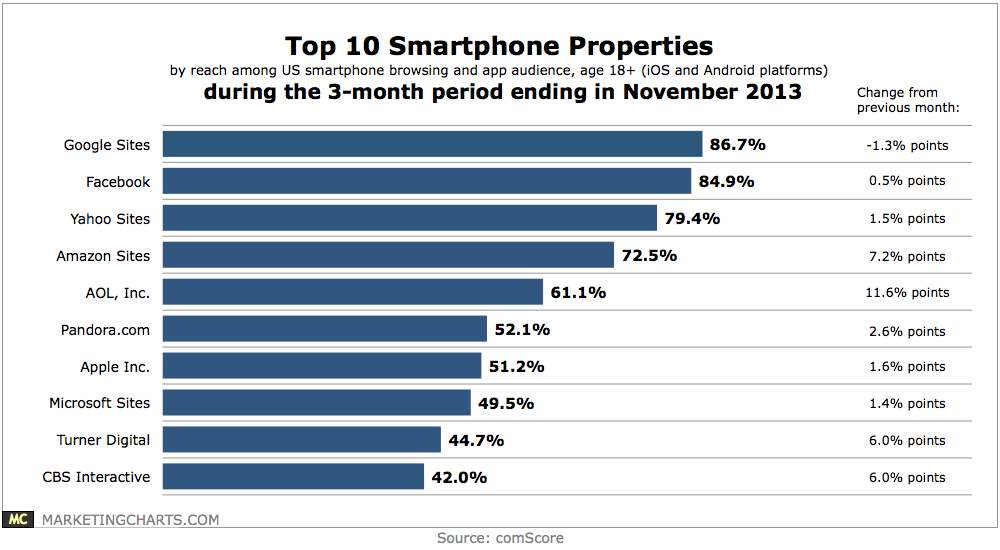
During the 3-month period ending in November 2013, Amazon Sites enjoyed 72.5% reach among the US smartphone audience (mobile browsing and application usage), up from 65.3% the previous month.
Read MoreMobile Share Of Online Shopping Traffic & Sales, Q4 2013 [CHART]
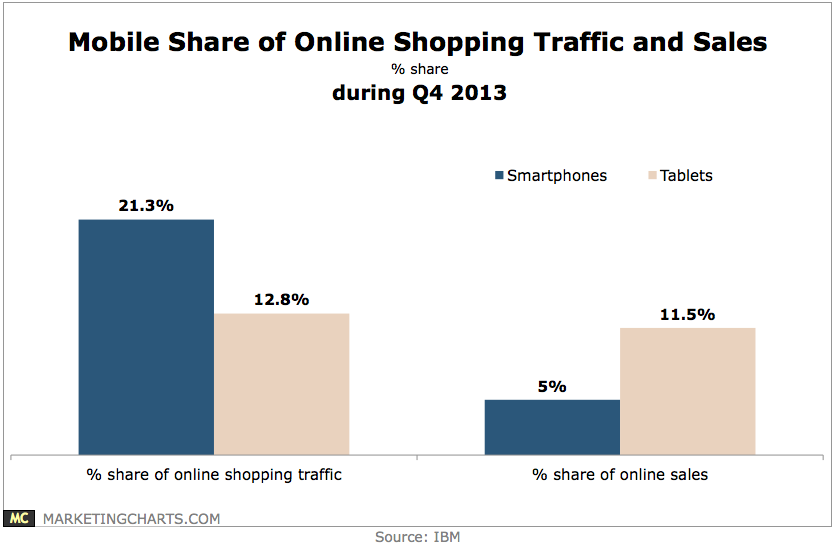
While smart phones far surpassed tablets in online shopping traffic share (21.3% vs. 12.8%) during the fourth quarter, tablets drove 11.5% of all online sales, compared to 5% for smart phones.
Read More