Posts Tagged ‘Smart Phones’
Search Advertising Trends, Q1 2014 [TABLE]
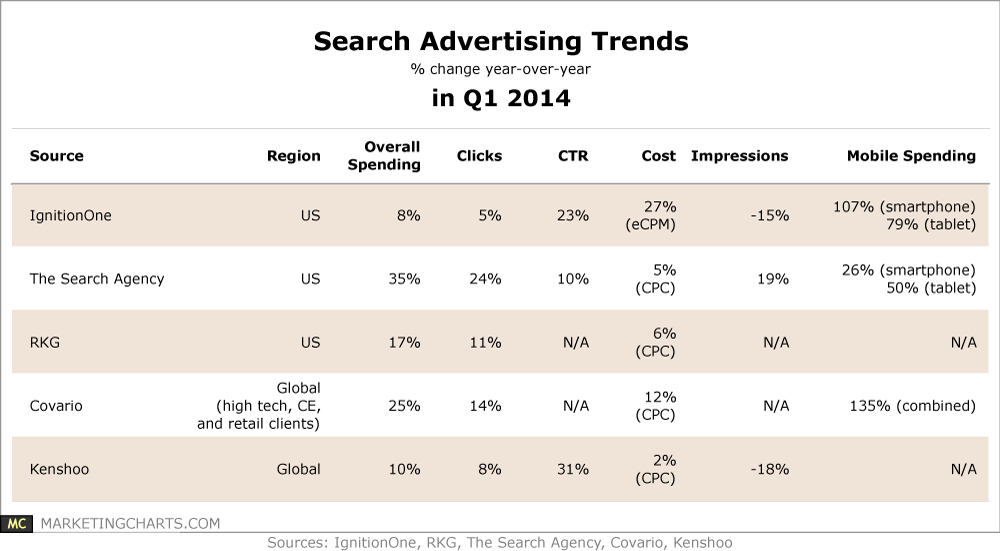
Spending is up (particularly on mobile), as are click-through rates.
Read MoreSmart Phone User Penetration In Western Europe By Country, 2012-2017 [TABLE]
The number of people in Italy owning at least one smartphone will reach an estimated 25.8 million this year.
Read MoreItalian Multitainment Activities, November 2013 [CHART]
Almost half (46.3%) of Italian smart phone users who used their phone for any activity related to a TV program said they visited social networks.
Read MoreLocal Search Conversions By Device, April 2014 [CHART]
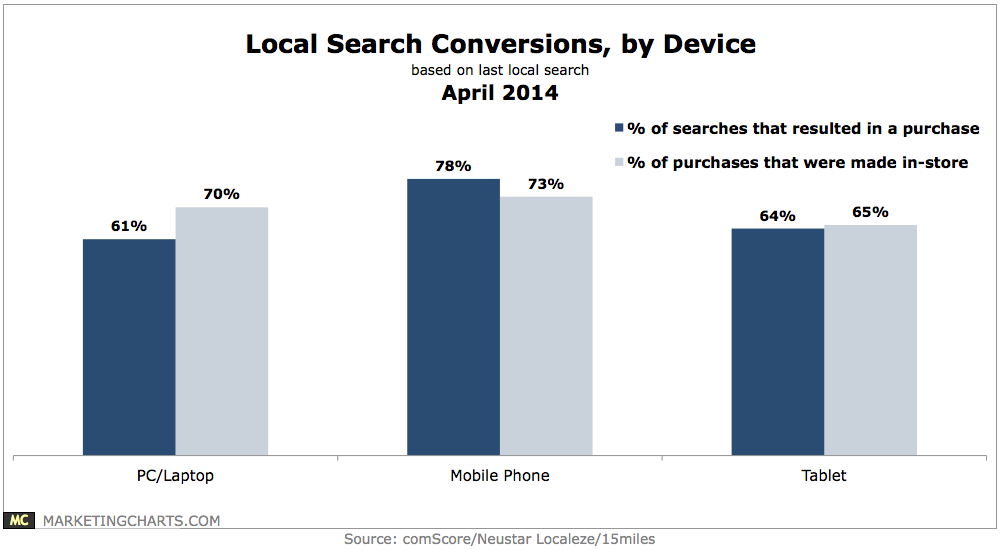
Some 78% of local searches conducted on a mobile phone result in a purchase, and 73% of those purchases are made in-store.
Read MoreMobile Germans Who Pay Favorable Attention To Ads By Device, March 2014 [TABLE]
In Germany only 8% to 12% said they favored ads on a smartphone, laptop or tablet but at least 40% said they paid attention to ads on those devices.
Read MoreMobile Spanish Users Who Pay Favorable Attention To Ads By Device, March 2014 [TABLE]
Nearly one-third (31%) of Spanish mobile users said they liked ads on TV, with the percentages for laptops and smartphones at 19% and 14%, respectively.
Read MoreFrench Mobile Users Who Pay Favorable Attention To Ads By Device, March 2014 [TABLE]
In France, 23% said they reacted favorably to ads on TV, while only 10% were well disposed to ads on their smartphones, and 9% welcomed ads on their laptops.
Read MoreSmart Phone Use While Shopping At Local Business, April 2014 [CHART]
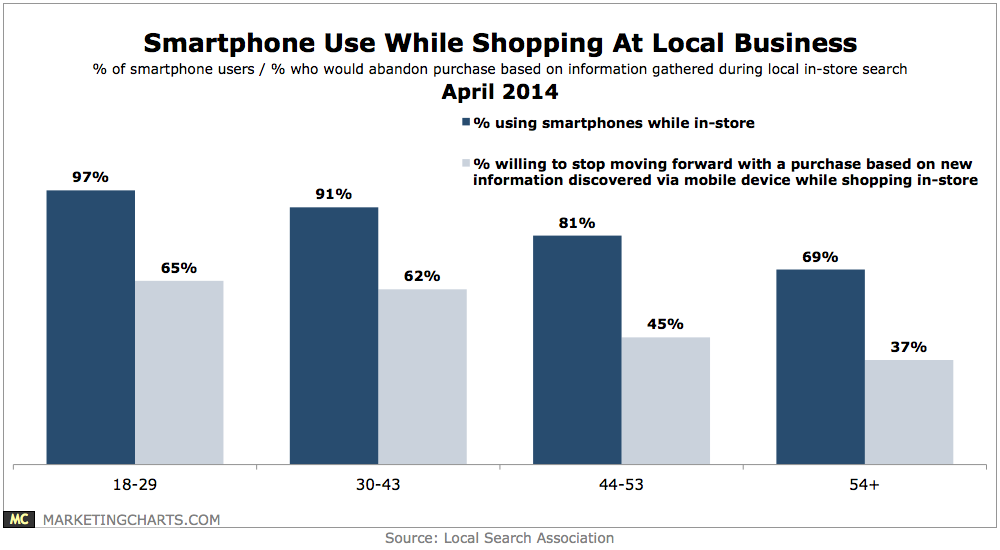
Some 65% of 18-29-year-old smartphone users (and 62% of device users aged 30-43) are willing to stop moving forward with a purchase based on new information they’ve turned up using their mobile device while shopping at a local business.
Read MoreDevices UK Consumers Use Along The Path To Purchase, September 2013 [TABLE]
Mobile’s share of UK retail website visits rose from 24.0% to 45.0% between Q4 2012 and Q4 2013.
Read MoreTV Viewing On Alternative Devices, 2012-2014 [CHART]
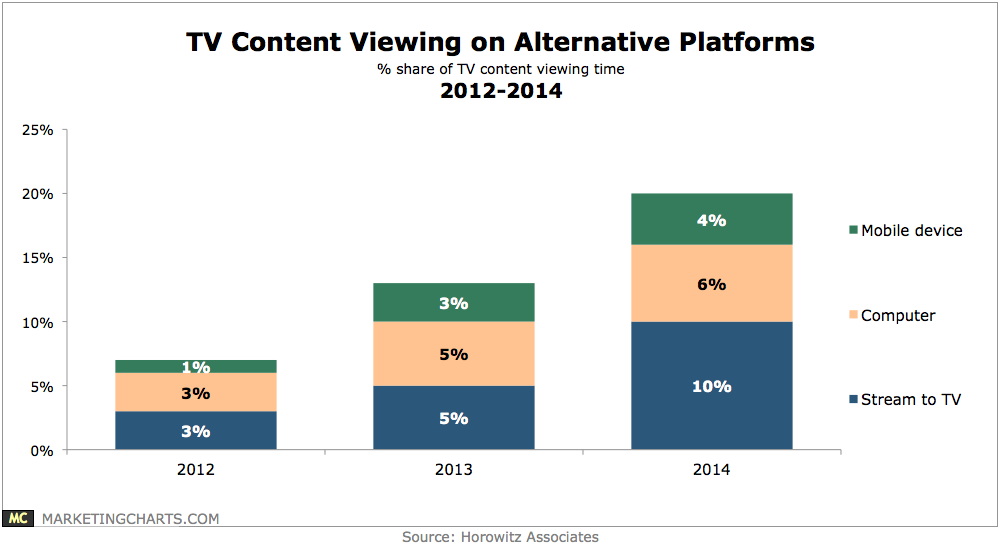
The 20% of TV content viewing time spent on alternative platforms is a significant step up from 13% last year, with the biggest change being for streaming to the TV set (10% this year, up from 5%).
Read More