Posts Tagged ‘Smart Phones’
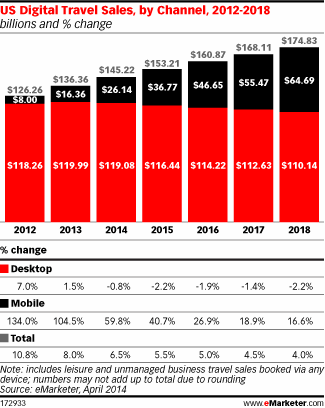
US Online Travel Sales By Channel, 2012-2018 [CHART]
US mobile travel sales totaled $16.36 billion in 2013 and will increase another 59.8% this year to reach $26.14 billion.
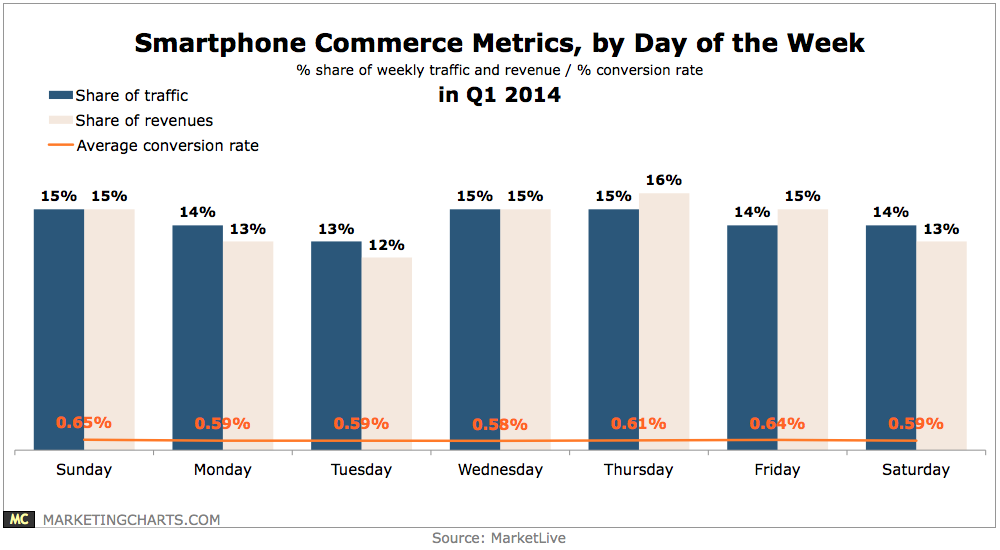
Read MoreSmart Phone Commerce Metrics By Day Of The Week, Q1 2014 [CHART]
Mondays and Saturdays tied for the second-largest share of weekly revenues (15% each).
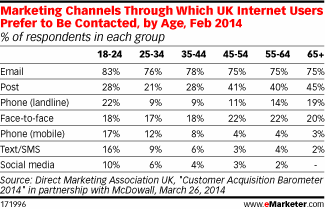
Read MoreMarketing Channels UK Consumers Prefer For Contact By Age, February 2014 [TABLE]
Email was the preferred marketing channel among UK internet users across all age groups.
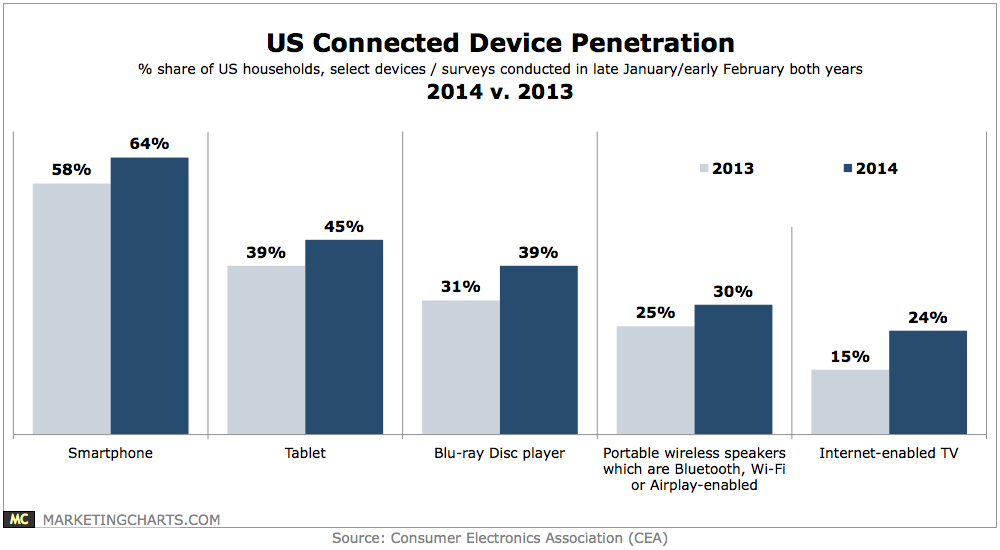
Read MoreUS Connected Device Penetration, 2013 vs 2014 [CHART]
Some 45% of households own a tablet as of late January, up 6% points from the comparable period last year, and 16% plan to purchase one this year.
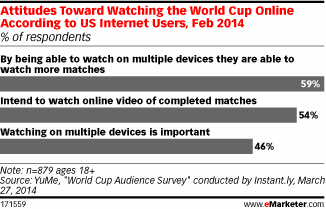
Read MoreAttitudes Toward Watching The World Cup Online, February 2014 [CHART]
Nearly half of adult US internet users said that being able to watch the soccer games on multiple devices was important to them.
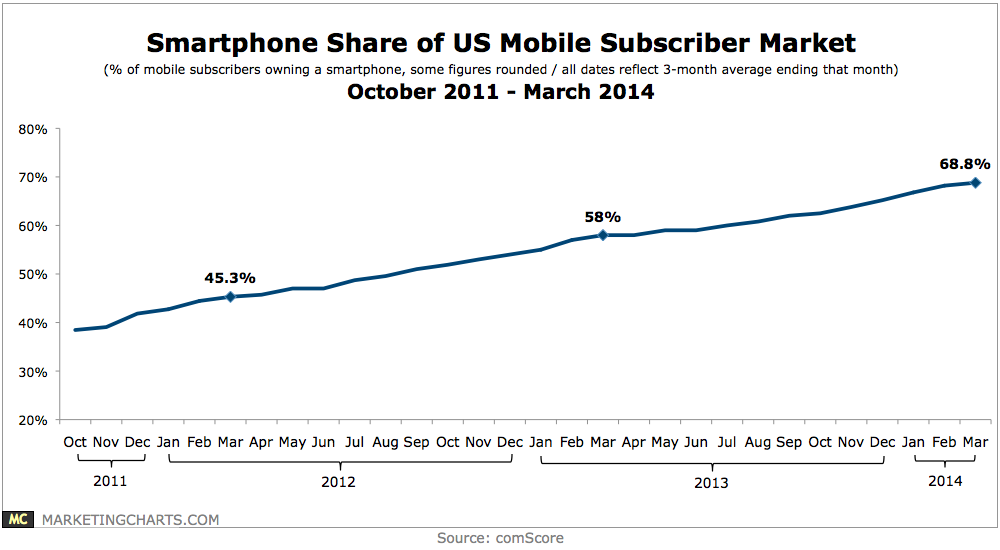
Read MoreUS Smartphone Penetration, October 2011 – March 2014 [CHART]
Smartphone penetration reached 68.8% of the US mobile market during Q1, up from 65.2% in Q4 2013 and 58% in Q1 2013.
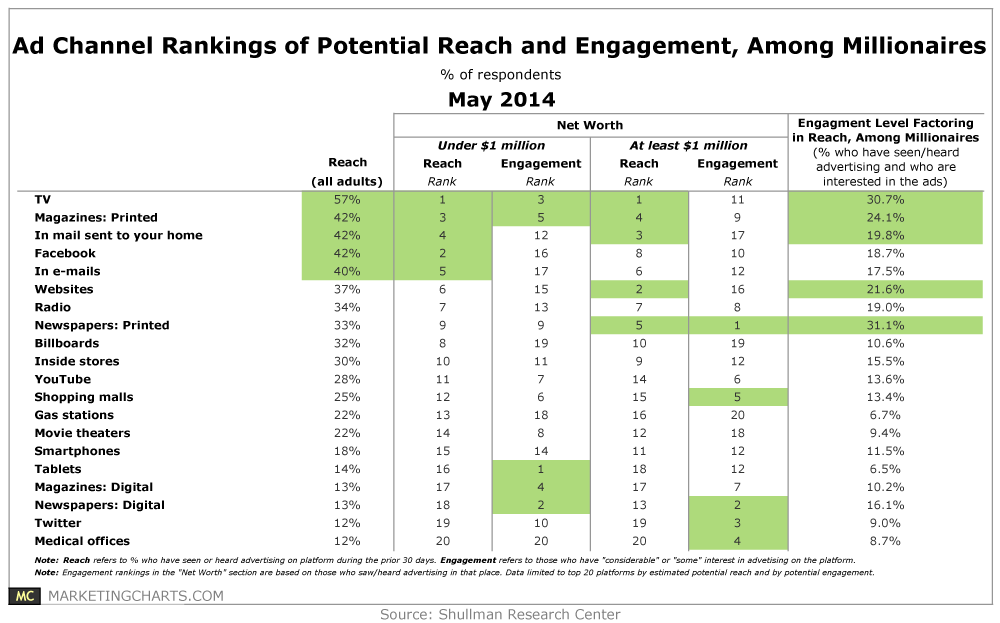
Read MoreAd Channel Rankings By Reach & Engagement Among Millionaires, May 2014 [TABLE]
Traditional channels represent 4 of the top 5 advertising channels by reach among millionaires, with TV topping the list.
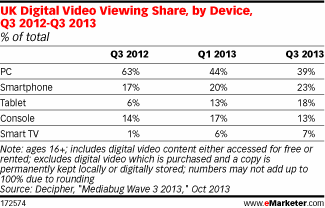
Read MoreUK Online Video Viewing Share By Device, Q3 2012-Q3 2013 [TABLE]
Smart phones were accounting for a growing proportion of digital video viewing among the general UK population—up from 17% in Q3 2012 to 23% in Q3 2013.
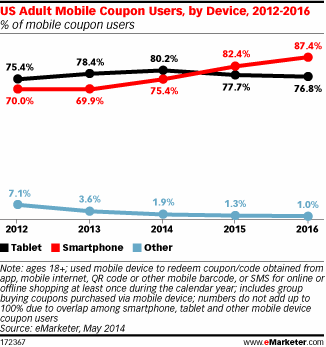
Read MoreAmerican Mobile Coupon Users By Device, 2012-2016 [CHART]
Mobile coupon users will be slightly more likely to redeem a coupon or code via tablet than smartphone in 2014.
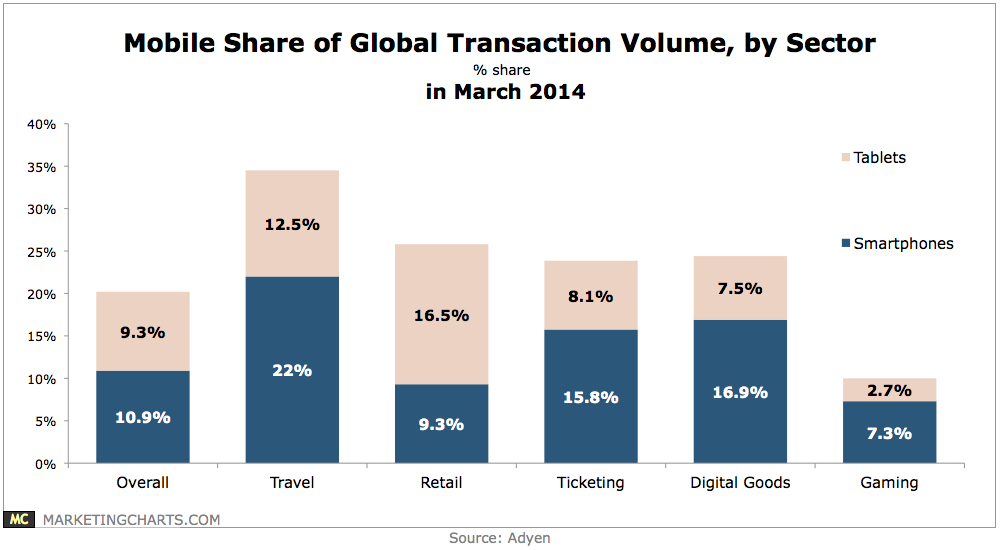
Read MoreMobile Share Of Global Transaction Volume By Sector, March 2014 [CHART]
Smart phones (10.9%) and tablets (9.3%) together accounted for more than 1 in 5 payment transactions globally in March.
Read More