Posts Tagged ‘Shopping’
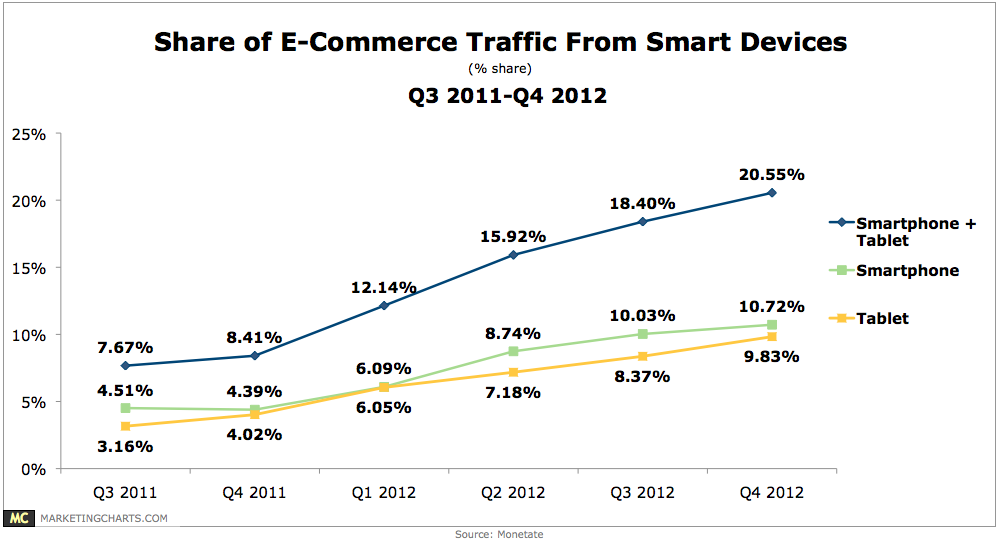
eCommerce Traffic From Smart Devices, Q3 2011 – Q4 2012 [CHART]
Traffic from smart phones has jumped from 4.1% share of online shopping sessions in Q4 2011 to 10.7% in Q4 2012, while tablets’ share of eCommerce traffic has grown from 4.1% to 9.8%.
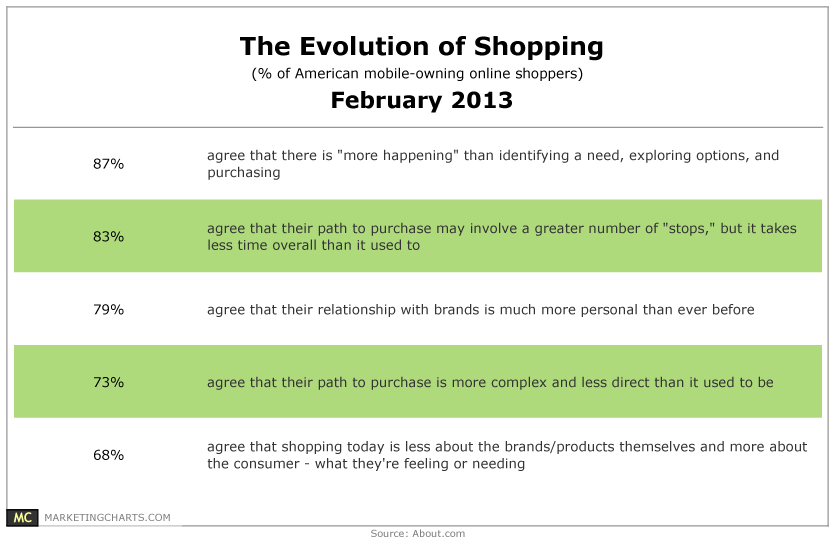
Read MoreThe Evolution Of Shopping, February 2013 [TABLE]
73% of online shoppers agree that their path to purchase is more complex and less direct than it used to be.
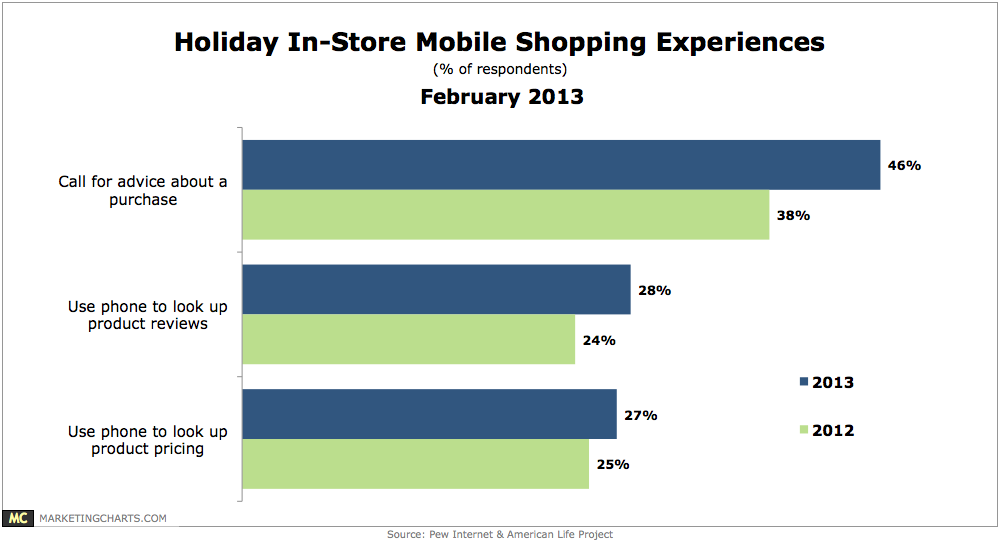
Read MoreHoliday In-Store Mobile Shopping Experience, February 2013 [CHART]
More adult mobile owners used their devices to help them shop during the 2012 holidays than during the 2011 season.
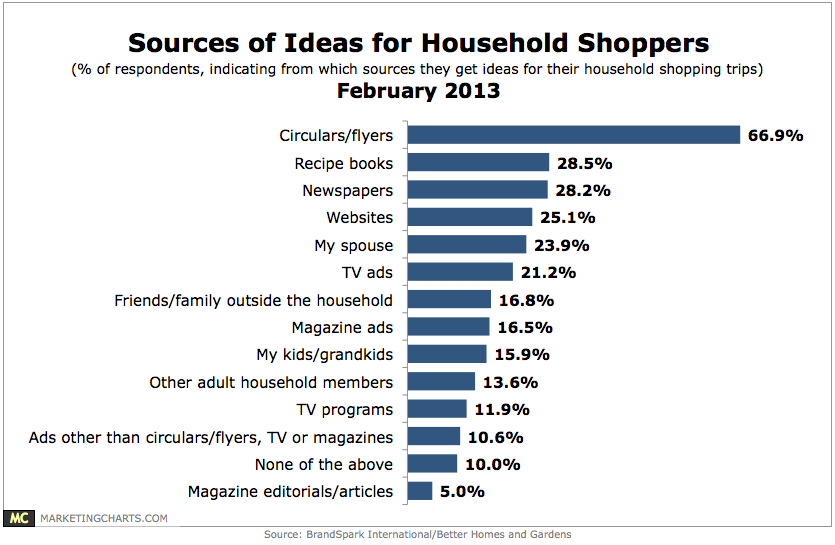
Read MoreHousehold Shopping Inspiration Sources, February 2013 [CHART]
66.9% of American consumers say they get ideas for their shopping trips from circulars and flyers.
Read MoreOnline Shopping Cart Metrics, Q3 2011 – Q3 2012 [CHART]
The add-to-cart rate increased by 2 percentage points, while the cart conversion rate decreased by 2.7 points from 2011 to 2012.
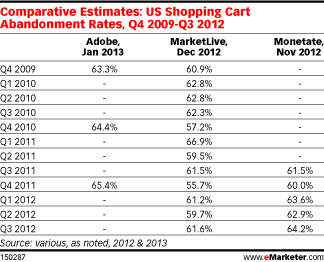
Read MoreShopping Cart Abandonment Rates, Q4 2009 – Q3 2012 [CHART]
Over the past four years shopping cart abandonment rates have run in the 60% range, meaning six in 10 shoppers who place items in a cart do not check out.
Read MoreReasons For Online Shopping Cart Abandonment, February 2012 [CHART]
Smart retailers are recognizing that while some abandoned carts do indeed represent missed revenue opportunities, many others do not.
Read MoreTop Reasons For eCommerce Abandonment, January 2013 [CHART]
The top reason why online shoppers abandon a purchase is due to encountering unexpected delivery costs, cited by 70% of respondents.
Read MoreAmerican Hispanics' Social Shopping Activities, May 2012 [CHART]
While 48% of Hispanics involved social networking sites in their shopping activities, only 31% of non-Hispanics did so.
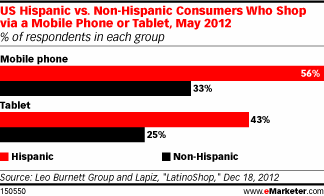
Read MoreAmerican Hispanic Mobile Shoppers By Device, May 2012 [CHART]
Not only are Hispanics more likely than non-Hispanics to use a smartphone, but they’re a lot more likely to shop with it.
Read More