Posts Tagged ‘Search Behavior’
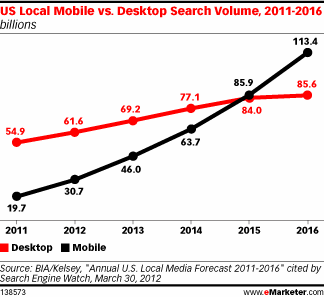
US Local Mobile vs Desktop Search Volume, 2011-2016 [CHART]
Google estimated that 20% of searches across all platforms worldwide have local intent.
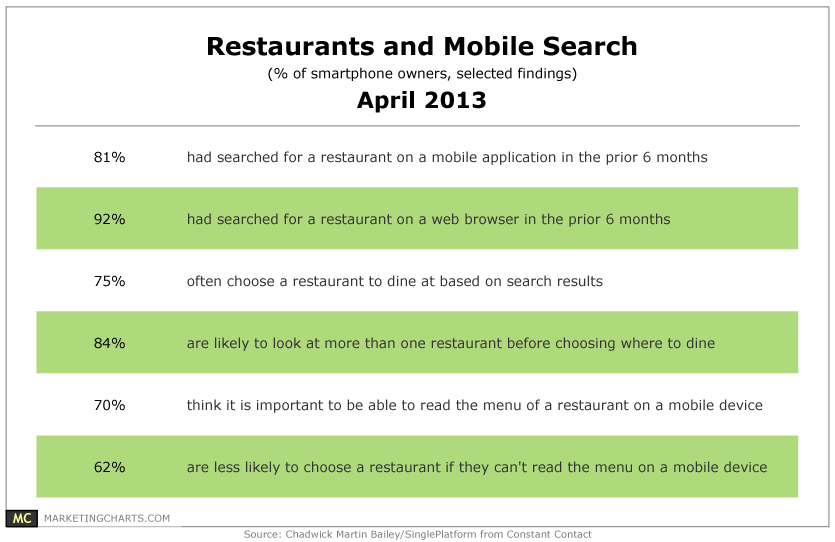
Read MoreRestaurants & Mobile Search Behavior, April 2013 [TABLE]
In the previous 6 months, 81% of respondents had searched for a restaurant via a mobile application, and 92% through a web browser.
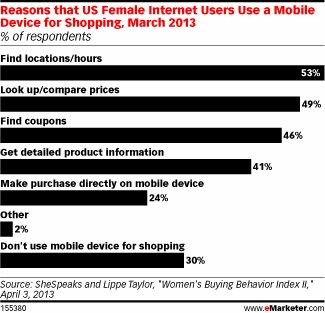
Read MoreWhy American Women Use Mobile For Shopping, March 2013 [CHART]
Just over a majority of American women said they used their mobile device to find store locations and hours.
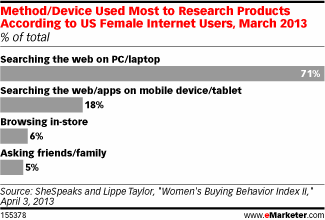
Read MoreHow American Women Research Products, March 2013 [CHART]
Only 6% of American women reported still researching products primarily in-store, while another 5% asked friends and family for recommendations most often.
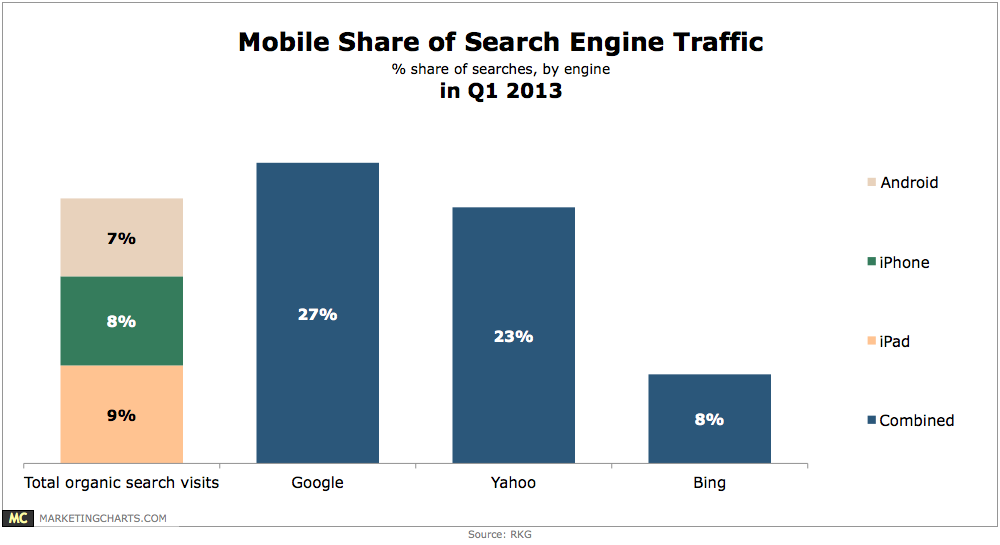
Read MoreMobile Share Of Search Traffic, Q1 2013 [CHART]
Tablets and smart phones combined accounted for roughly 24% of organic search visits in Q1.
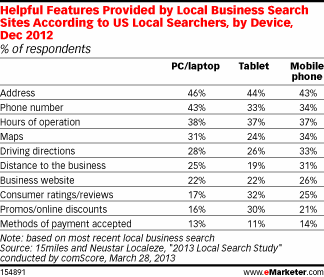
Read MorePopular Features Of Local Business Search Sites By Device, December 2012 [TABLE]
Around 77% of those who conducted a local search on either a mobile phone or tablet went on to make a purchase either in-store, online or over the phone.
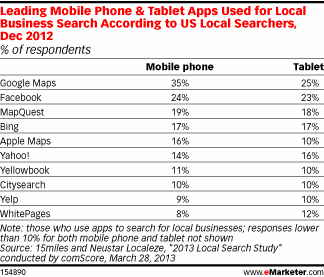
Read MoreTop Mobile Apps Used For Local Business Search, December 2012 [TABLE]
Google Maps was the No. 1 app used for local searches on phones and tablets, at 35% and 25%, respectively.
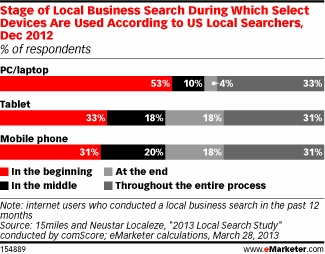
Read MoreDevices Used By Stage Of Local Business Searches, December 2012 [CHART]
Where mobile phones and tablets really showed their specific utility was in the share of local searches that ended on the devices—18% for each, compared with 4% of PC searches.
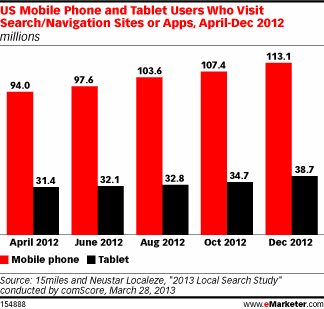
Read MoreMobile Americans Who Use Search/Navigation Sites or Apps, April-December 2012 [CHART]
In only eight months, the number of overall US searches on mobile phones and tablets rose 21%.
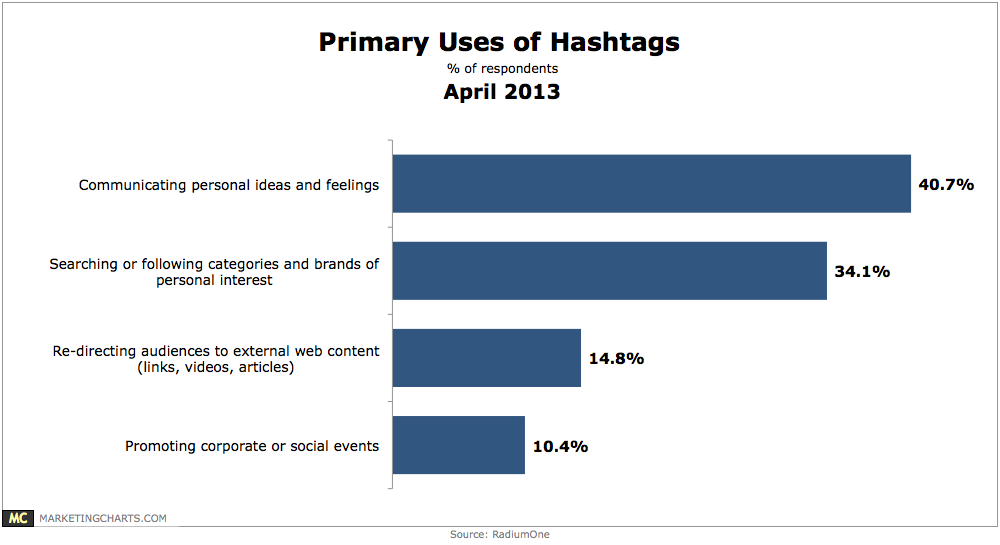
Read MorePrimary Uses Of Hashtags, April 2013 [CHART]
Hashtags are used primarily to communicate personal ideas and feelings (40.7%) and to search or follow categories and brands of personal interest (34.1%).
Read More