Posts Tagged ‘Search Behavior’
Mobile Voice Search Activities By Age Group, September 2014 [CHART]
55% and 41% of US teen and adult smartphone users conducted voice search daily, respectively.
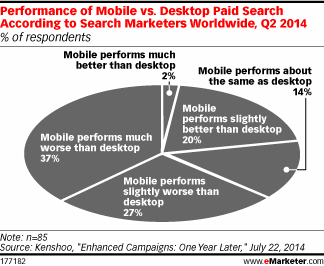
Read MoreSearch Advertising Performance: Desktop vs Mobile, Q2 2014 [CHART]
Nearly two-thirds of global marketers polled by Kenshoo in Q2 2014 said mobile search underperformed compared with desktop search campaigns.
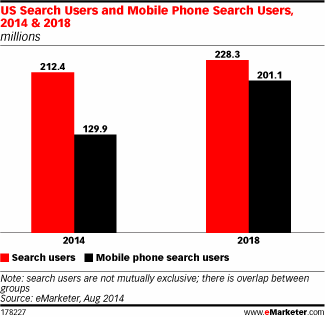
Read MoreUS Desktop vs Mobile Search Users, 2014 & 2018 [CHART]
eMarketer estimates that 40.7% of the US population will use a mobile phone to search the internet at least once per month in 2014.
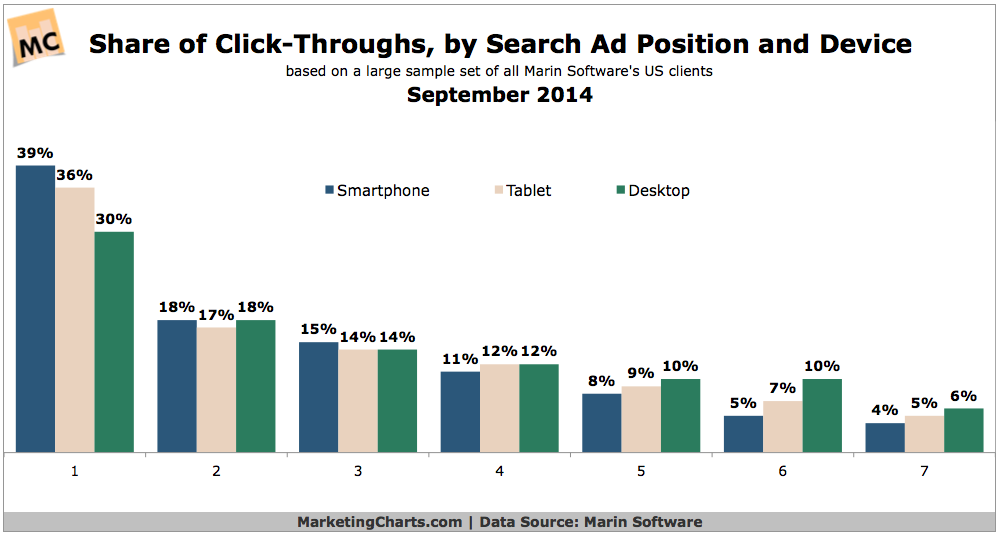
Read MoreShare Of Clicks By Search Ad Position & Device, September 2014 [CHART]
The top position garners 39% share of clicks on smartphones, compared to 36% on tablets and 30% on desktops.
Read MoreClick-Through Rates For Google Organic Results By Ranking Position [CHART]
Click-Through Rate For Google Organic Results By Position: On average, 71.33% of searches resulted in a page one Google organic click.
Read MoreSearch CTR For Links With Video Thumbnails By Search Position [CHART]
The average CTR for Position 1 of a video was 7.9 percent, whereas the average CTR for a classic result was 20 percent.
Read MoreMobile's Share Of Organic Search Traffic, Q2 2012-Q2 2014 [CHART]
Mobile devices accounted for 34% of US organic search visits during the second quarter of the year, up from 31% during Q1.
Read MoreOrder In Which People Pay Attention To Search Results That Include Video Thumbnails [FIXATION MAP]
This heatmap illustrates the order in which search engine users fix their attention on search results that include video thumbnails.
Read MoreHow People View Search Results That Contain Video Thumbnails [HEATMAP]
This heatmap illustrates how search engine users pay attention to search results that include video thumbnails.
Read MoreHow People View Search Results With Social Annotations [HEATMAP]
This heatmap illustrates how search engine users pay attention to search results that include social annotations.
Read More