Posts Tagged ‘Rich Media Advertising’
Online Ad Revenue Share By Format, 2013 vs 2014 [CHART]
Mobile ad spending comprised almost one-quarter (23%) of total online ad spend.
Read MoreLuxury Rich Media Ad Metrics vs Global Benchmarks, H1 2014 [TABLE]
The average clickthrough rate (CTR) for any polite banner ad in H1 2014 was just 0.13%. But for luxury ads of the same format, CTRs rose to 0.37%.
Read MoreUS Online Ad Revenue Share By Format, 2013-2014 [CHART]
Mobile ad spending comprises almost one-quarter (23%) of total online ad spend.
Read MoreUS Online Display Ad Spending Share By Format, 2013-2018 [CHART]
Video’s share of digital display ads in the US will gain significant ground throughout our forecast period, increasing from 21.6% of all digital display advertising last year to 30.1% by 2018.
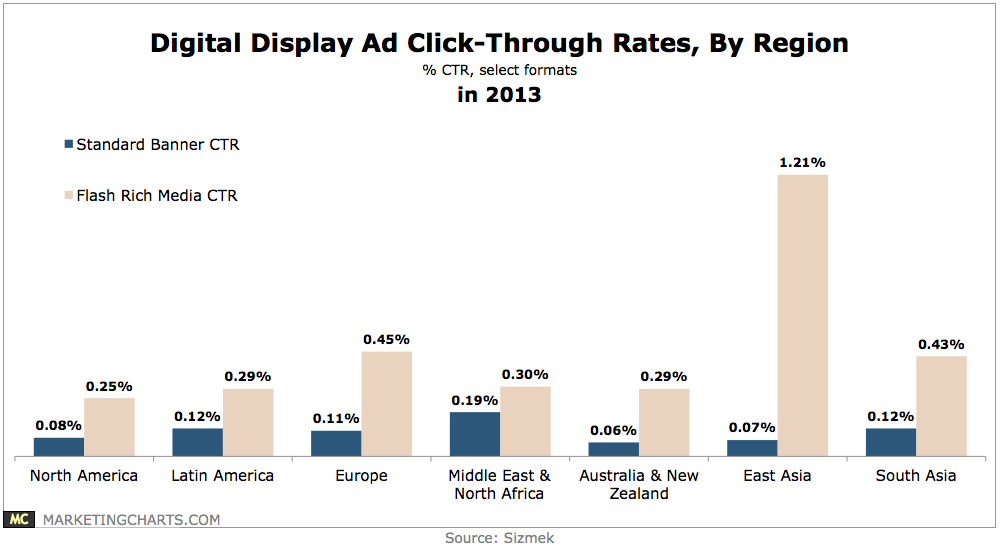
Read MoreOnline Display Ad Benchmarks By Region in 2013 [CHART]
In North America, the average click-through rate (CTR) for standard banners slipped from 0.1% to 0.08%, while flash rich media CTRs jumped from 0.14% to 0.25%.
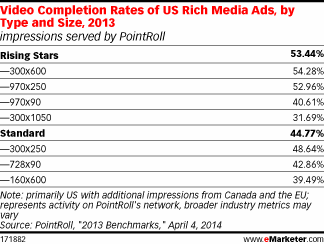
Read MoreVideo Completion Rates Of Rich Media Ads By Type & Size, 2013 [TABLE]
Clickthrough rates for rising stars were 70% higher than for standard placements, and video completion rates experienced a 19% lift.
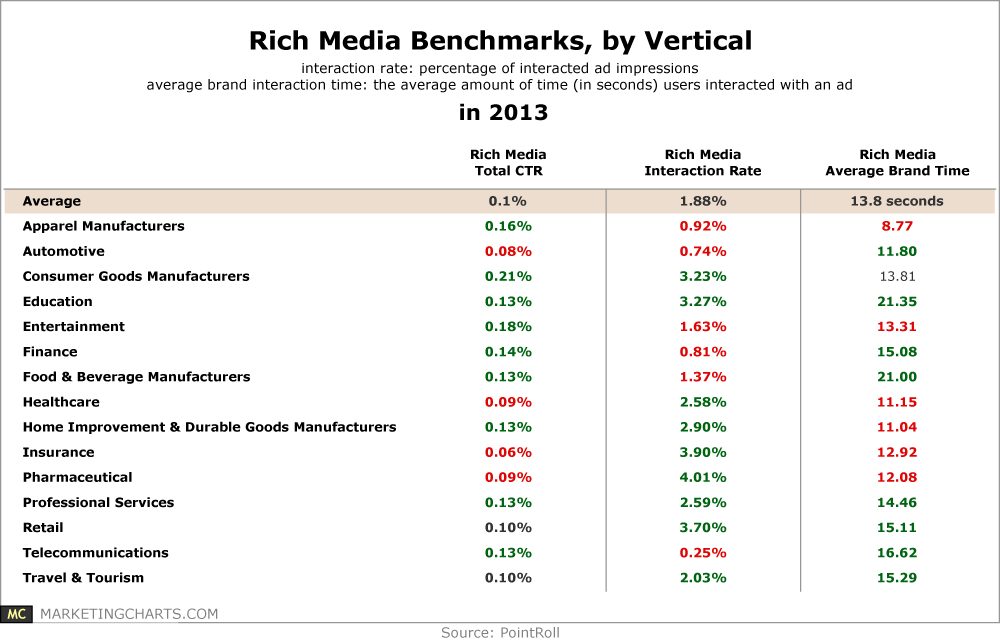
Read MoreRich Media Ad Benchmarks By Vertical, 2013 [TABLE]
Rich media click-through and interaction rates were higher when including video.
Read MoreMobile Rich Media & Video Ad CTR vs Standard Banners, 2013 [CHART]
Mobile ads that integrated interactive and animated features saw click-through rates (CTRs) multiple times higher than standard banner ads last year across a variety of verticals.
Read MoreUS Restaurant Mobile Ad Features, Q4 2013 [TABLE]
Nearly half of consumers had tried a new restaurant or menu item based on a mobile ad.
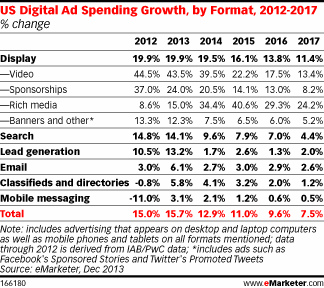
Read MoreUS Online Ad Spending Growth By Format, 2012-2017 [TABLE]
Programmatic buying, native advertising and viewability all remain topical to digital display advertisers, particularly brands.
Read More