Posts Tagged ‘Revenues’
US Search Ad Revenue Market Share, 2011-2015 [TABLE]
Google’s share of net US search ad revenues is expected to reach 73.7% this year, up from 72.8% in 2012.
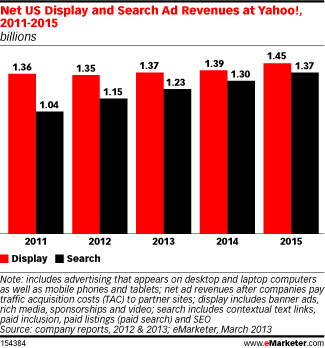
Read MoreYahoo!'s Display & Search Advertising Revenues, 2011-2015 [CHART]
eMarketer estimates net US search ad revenues at Yahoo! will grow 7% to $1.23 billion this year, up from $1.15 billion in 2012.
Read MoreRevenues & Profits Of Tech Giants [INFOGRAPHIC]
This infographic from Staff.com illustrates the financial performance of Apple, Microsoft, Amazon, Google and Facebook.
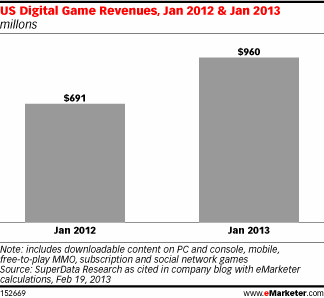
Read MoreUS Digital Game Revenues, January 2012 & January 2013 [CHART]
SuperData pegged the digital games market at $960 million at the beginning of this year, up from $691 million in January 2012.
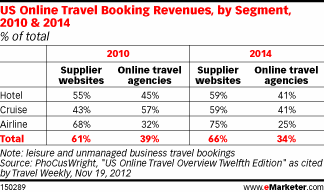
Read MoreUS Online Travel Booking Revenues By Segment, 2010 & 2014 [TABLE]
Almost 60% of online cruise bookings in 2014 will come via supplier websites, with the remaining purchased via online travel agencies.
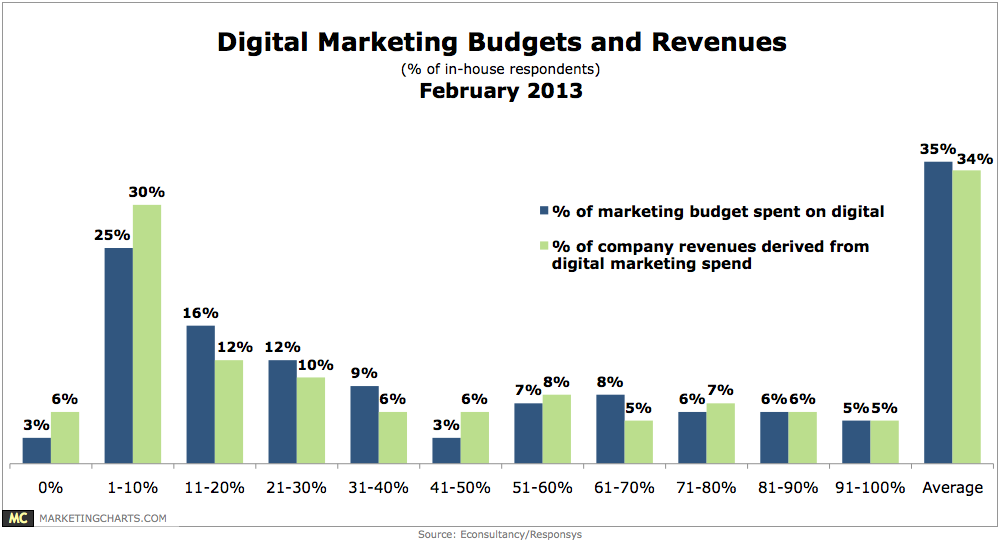
Read MoreOnline Marketing Budgets & Revenues, February 2013 [CHART]
In-house marketers report spending on average 35% of their total marketing budgets on digital.
Read MorePercentage Of North American Circulation Revenues From Mobile, October 2012 [CHART]
Mobile did not play a huge role in media companies’ circulation revenues, but many expected that to change by 2014, when over four out of 10 anticipated making at least 10% of their circulation revenues—excluding ad dollars—from mobile.
Read MoreChristmas 2012 Apple App Downloads & Revenues [CHART]
Apple’s App Store downloads increased 87 percent on Christmas Day compared to the December 2012 average.
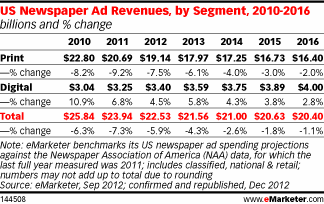
Read MoreUS Newspaper Ad Revenues By Segment, 2010-2016 [TABLE]
In the US, eMarketer estimates that newspaper print ad revenue will decline and newspaper digital ad revenue will increase in each of the next four years.
Read MoreUS Mobile Gaming Revenues, 2010-2016 [CHART]
US mobile gaming revenue will come from a combination of paid downloads, in-game purchases of virtual goods and in-game advertising.
Read More