Posts Tagged ‘Revenues’
Global Mobile Ad Revenues & Format Shares, 2011 vs 2012 [CHART]
Global mobile ad revenues grew by 83% year-over-year in 2012, climbing from $4.8 billion to $8.9 billion.
Read MoreAmerican Video Game Sales Revenues By Type, 2009-2012 [CHART]
Revenues from video game sales reached $14.8 billion last year.
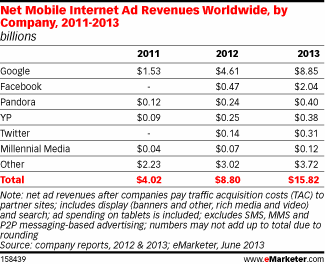
Read MoreGlobal Mobile Ad Revenues By Company, 2011-2013 [TABLE]
eMarketer estimates that Google made $4.61 billion in mobile internet ad revenues last year, more than triple its earnings in 2011.
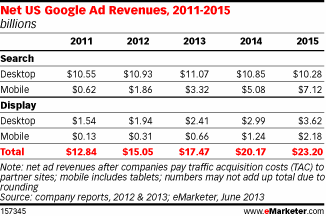
Read MoreUS Google Net Ad Revenues, 2011-2015 [TABLE]
Mobile’s rapid expansion will help that channel rival the desktop in both search and display revenues for Google by 2015.
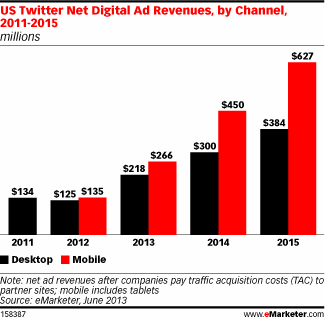
Read MoreUS Twitter Net Ad Revenues, 2011-2015 [CHART]
As of 2012, eMarketer estimates, 52% of Twitter’s net US ad revenues were from mobile; by 2015, the share will approach two-thirds.
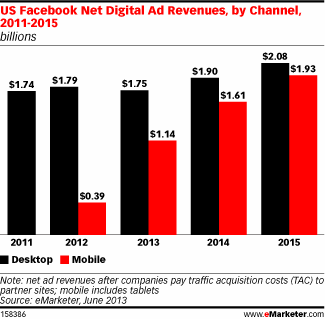
Read MoreUS Facebook Net Ad Revenues, 2011-2015 [CHART]
eMarketer estimates that after less than a full year selling mobile ads, 18% of US net Facebook ad revenues came from mobile in 2012.
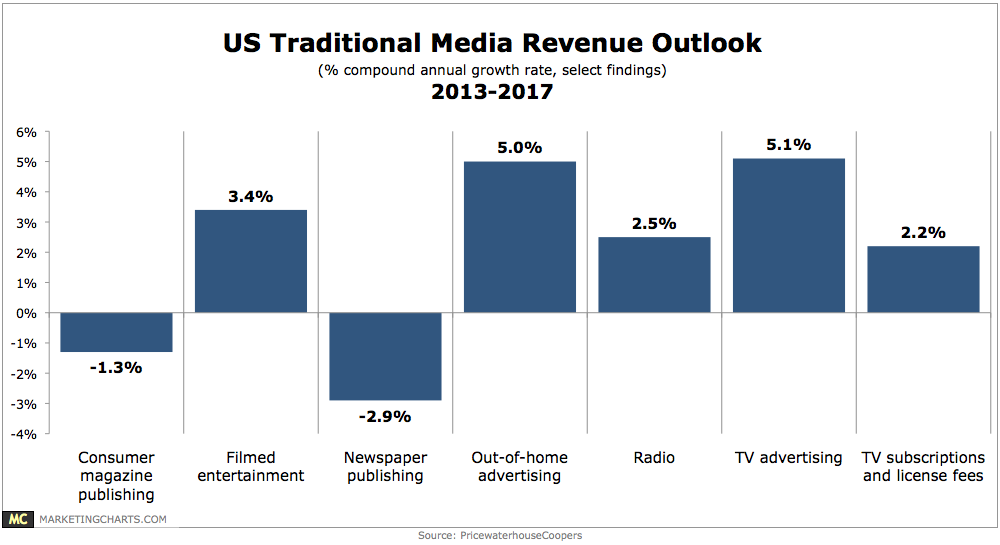
Read MoreUS Traditional Media Revenue Outlook, 2013-2017 [CHART]
PwC has issued its annual “Entertainment & Media Outlook” report, which contains projections for online and offline media markets through 2017.
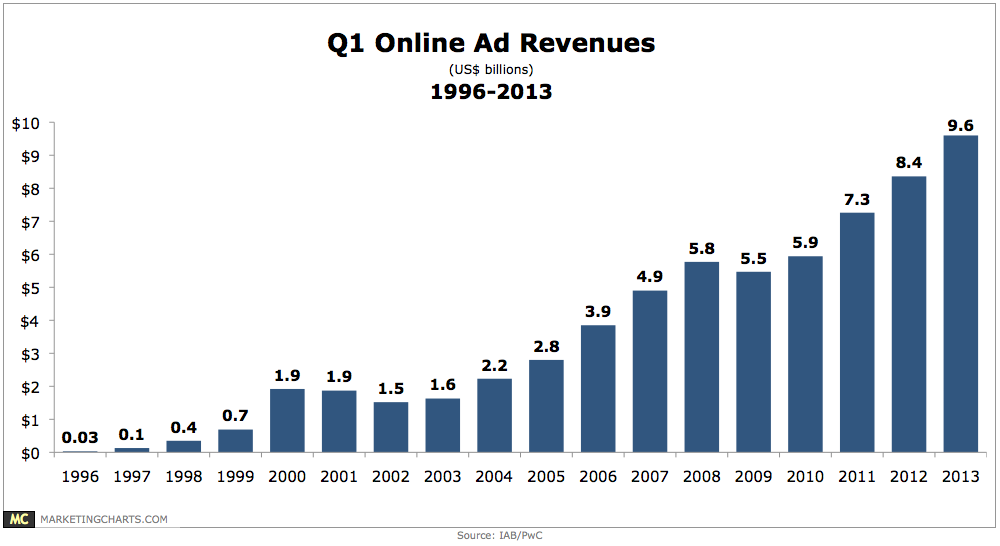
Read MoreQ1 Online Ad Revenues, 1996-2013 [CHART]
Online ad revenues grew by 15.8% year-over-year in Q1, increasing from $8.3 billion to $9.6 billion.
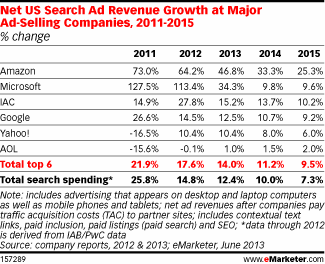
Read MoreNet US Search Ad Revenue Growth By Major Ad Networks, 2011-2015 [TABLE]
Until last year Microsoft enjoyed the fastest growth rate among the six search ad publishers for which eMarketer forecasts revenues.
Read MoreNet US Search Ad Revenues By Major Ad Networks As % Of Spend, 2011-2015 [TABLE]
eMarketer now estimates that Microsoft will account for 4.6% of total US search ad revenues in 2013.
Read More
