Posts Tagged ‘Revenues’
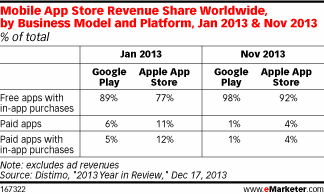
Mobile App Store Revenue Share By Platform [TABLE]
98% of Google Play store revenues and 92% of Apple App Store revenues in November 2013 came from free-to-download apps that offered in-app items for purchase.
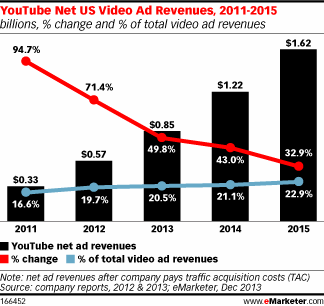
Read MoreYouTube Net US Video Ad Revenues, 2011-2015 [CHART]
YouTube’s revenues from video ad formats will hit $1.22 billion next year, claiming a 21.1% share of all US video ad revenues.
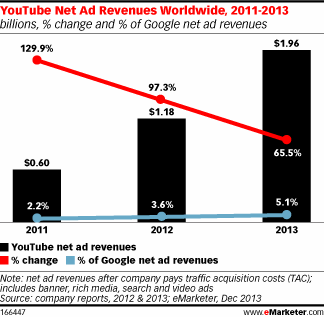
Read MoreGlobal YouTube Net Ad Revenues, 2011-2013 [CHART]
After paying back advertising partners and video content creators, eMarketer still expects the company to net $1.96 billion in ad revenues worldwide this year, up 65.5% over 2012.
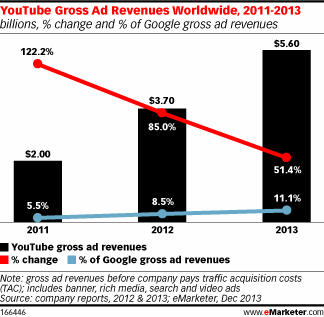
Read MoreGlobal YouTube Gross Ad Revenues, 2011-2013 [CHART]
YouTube will bring in about $5.60 billion in gross ad revenues this year.
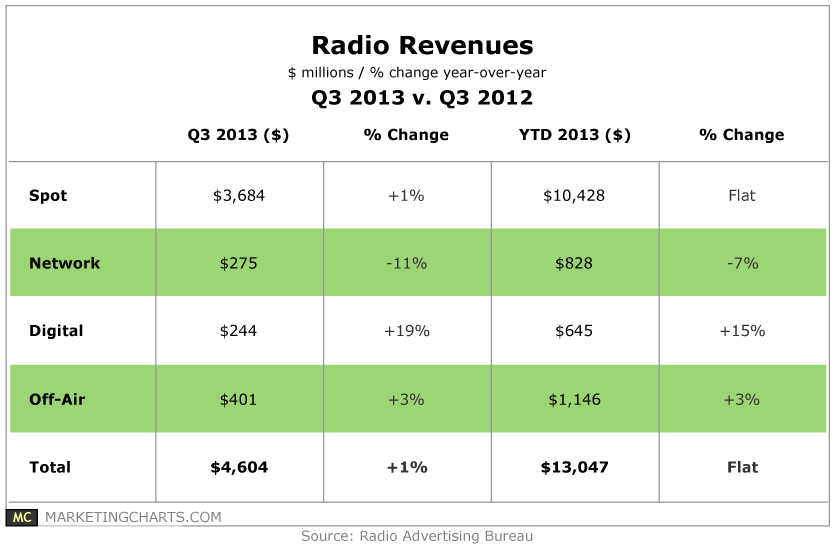
Read MoreRadio Revenues, Q3 2012 vs Q3 2013 [TABLE]
Radio ad revenues grew marginally in Q3, up 1% year-over-year to reach $4.6 billion.
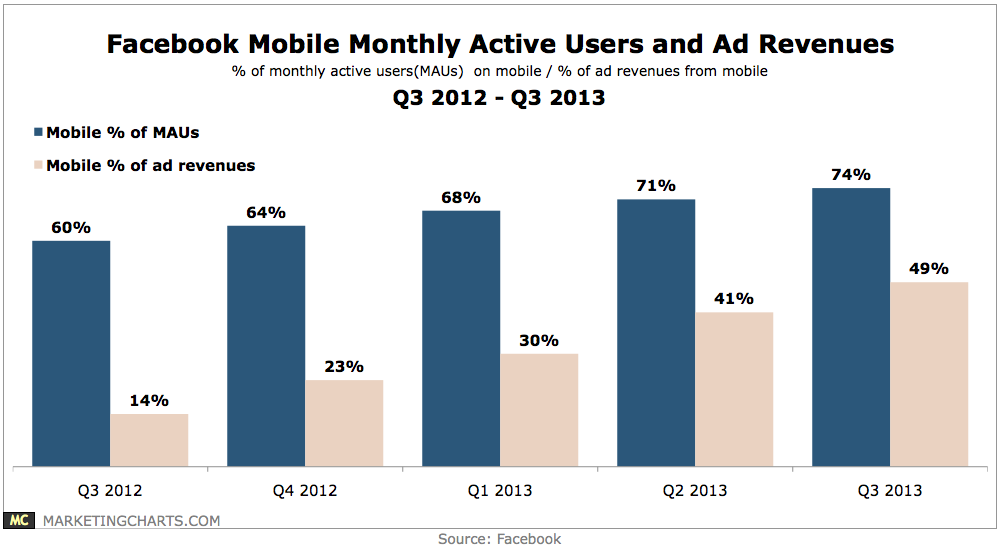
Read MoreFacebook Monthly Mobile Active Users & Ad Revenues, Q3 2012-Q3 2013 [CHART]
Facebook continues to successfully shift to a mobile-oriented platform, with mobile monthly active users (MAUs – 874 million) now comprising almost three-quarters of total MAUs (~1.2 billion), and mobile ad revenue now at 49% of a growing total.
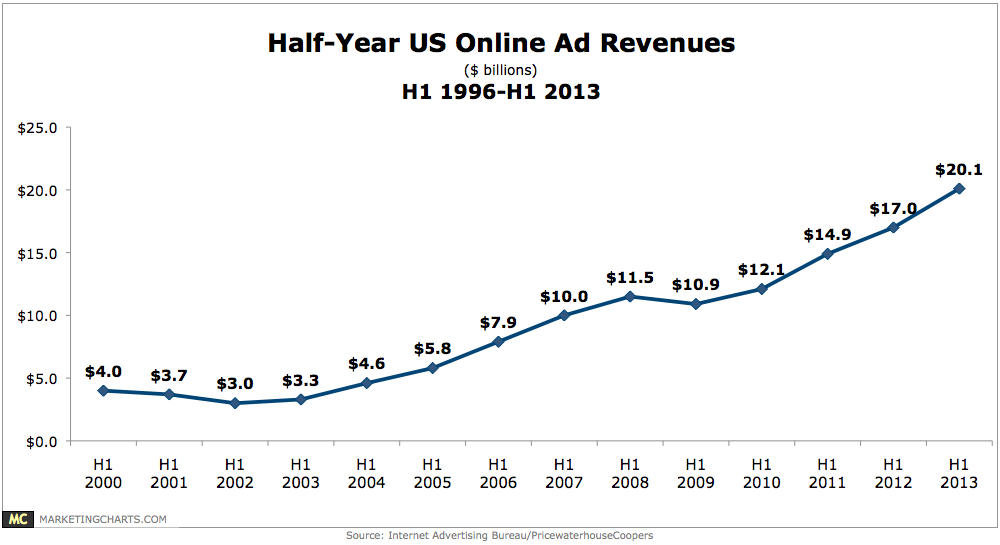
Read MoreOnline Ad Revenues, 1996-2013 [CHART]
Online ad revenues increased by 18% year-over-year to reach $20.1 billion in the first half of this year.
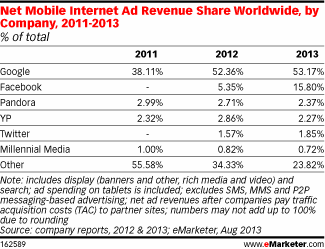
Read MoreNet Mobile Ad Revenue Share By Company, 2011-2013 [TABLE]
The company is expected to see its share of global mobile internet ad revenues reach 15.8% this year, up from just 5.35% in 2012.
Read MoreFacebook Mobile Monthly Active Users & Ad Revenues, Q3 2012 – Q2 2013 [CHART]
Mobile now accounts for 41% of Facebook ad revenues, a big jump from 30% in Q1.
Read MoreUS Mobile Video Revenues By Type, 2011-2017 [TABLE]
eMarketer forecasts that subscription-based mobile video revenues will top $2 billion by 2017, up from $1.25 billion in 2013.
Read More