Posts Tagged ‘Revenue’
B2B Media Revenue By Company Size, 2013-2014 [CHART]
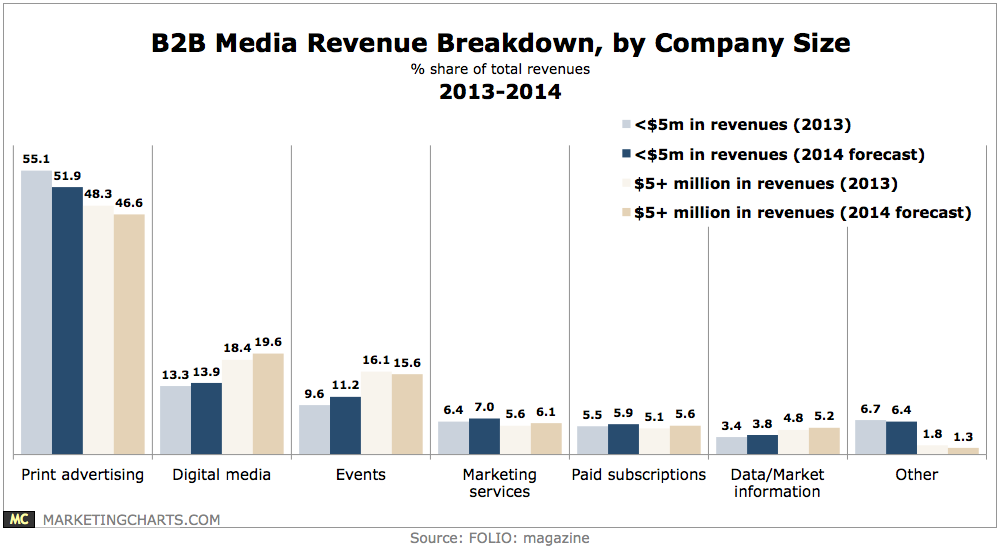
Print advertising remains remarkably resilient as the dominant revenue source for B2B publishers.
Read MoreUS Ad Revenue Forecast By Medium In 2014 [CHART]
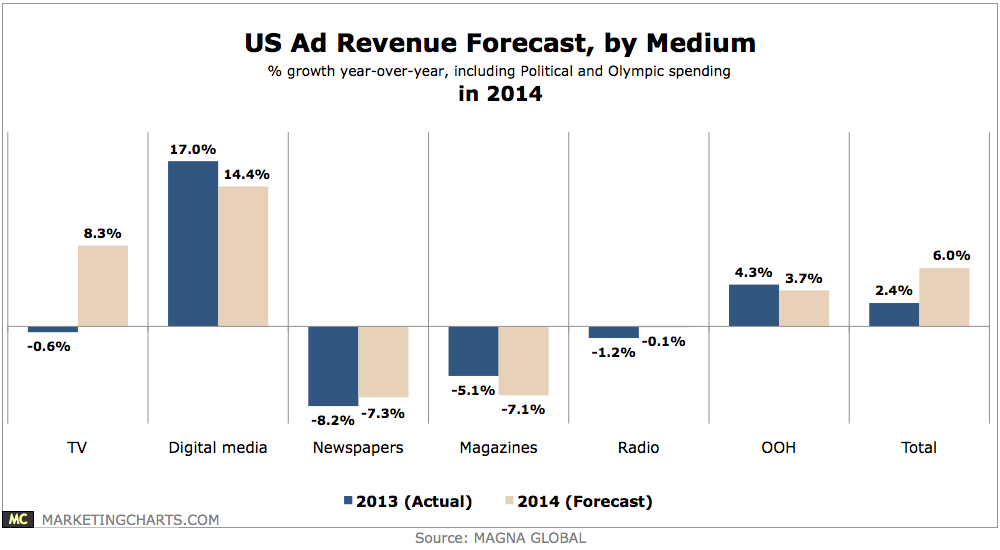
US media advertising sales are expected to grow by 6% this year, a figure revised upwards from a previous forecast of 5.5%.
Read MoreUS Local Media Revenue Forecast, 2013 & 2018 [CHART]
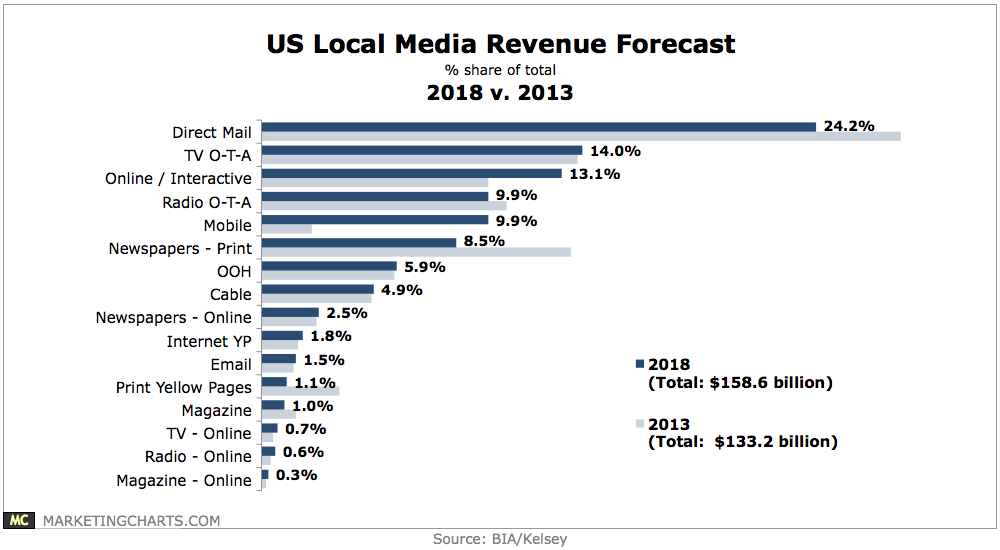
Local media revenues are expected to increase from $133.2 billion last year to $158.6 billion in 2018.
Read MoreGlobal Net Mobile Ad Revenue Share By Company, 2012 & 2013 [TABLE]
Globally, Google dominates the mobile ad landscape, with a 48.76% market share.
Read MoreGlobal Net Online Ad Revenue Share By Company, 2012 & 2013 [TABLE]
On a worldwide basis, Google and Facebook are also the top two ad publishers, with 31.91% and 5.64% of the market this year, respectively.
Read MoreGlobal Mobile Gaming Revenues, 2013 & 2018 [CHART]
Newzoo determined that the market overall would grow by about 162.6% between 2012 and 2016.
Read MoreGlobal Mobile Gaming Revenues By Device Type, 2012, 2013 & 2016 [CHART]
In 2012, tablets accounted for just over 23% of the mobile gaming market, while smartphones boasted a portion of nearly 77%—a 54-percentage-point lead.
Read MoreMonthly Average Video Game Revenue Per User By Game Type, 2012 [CHART]
Although mobile games are a growing category, they also generate less average revenue per user than other forms of gaming.
Read MoreUS Video Game Revenues By Type, 2009-2012 [CHART]
In 2012, the “other” video game category grew to $7.7 billion, up from $5.4 billion in 2009.
Read MoreUS Mobile Gaming Revenues By Type, 2011-2017 [CHART]
eMarketer estimates the number of US mobile phone gamers will reach 125.9 million in 2013.
Read More