Posts Tagged ‘Retail Marketing’
Tablet Ad Click-Through Rate Uplift By Industry, December 2012 [CHART]
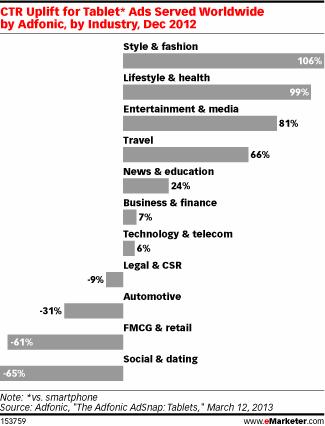
Click-through rates for entertainment and media, as well as the travel category rose by 81% and 66%, respectively.
Read MoreGoogle Universal Search Results By Content Type, 2012 [CHART]

A new study show the visibility of Google Shopping in Google’s Universal Search results dropped significantly after the search engine implemented a new paid inclusion model.
Read MoreGoogle's Universal Search [INFOGRAPHIC]
This infographic from Search Metrics illustrates their study of Google’s Universal Search results.
Read MoreLocal Business Searches Resulting In Purchase By Device, March 2013 [CHART]

Almost 86 million people use their mobile phones to seek local business information in the US.
Read MoreRetail Website Load Times, March 2013 [CHART]
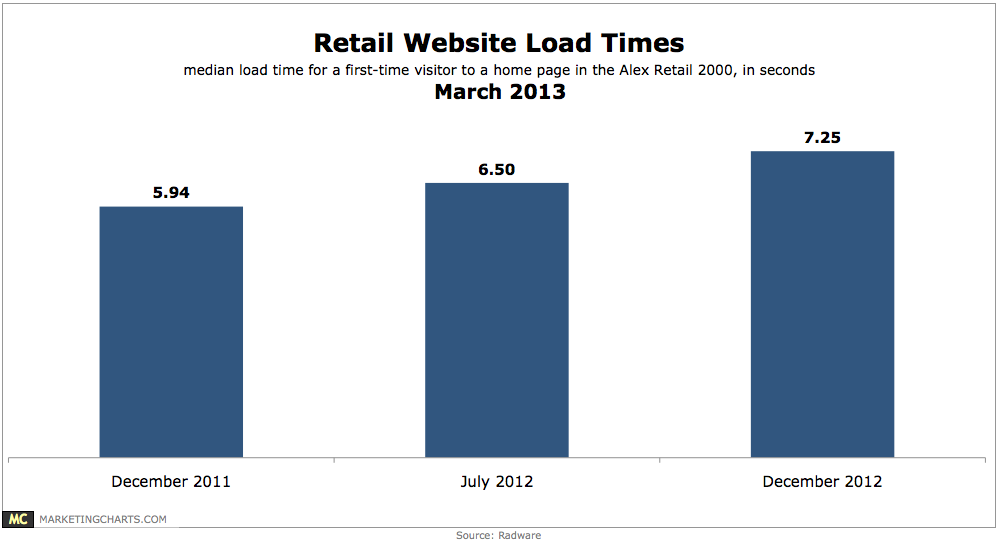
Between December 2011 and 2012, the median load time for home pages of top North American retail sites (the Alexa Retail 2000) slowed 22% from 5.94 to 7.25 seconds.
Read MoreTablet Traffic To US Websites Of Select Industries, January 2013 [CHART]
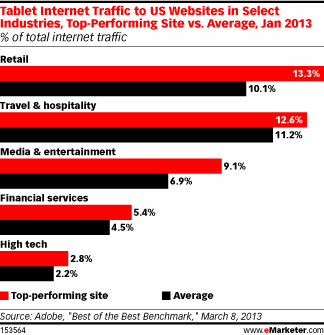
The top-performing retailer site studied got 13% of internet traffic from tablets.
Read MoreUS Smart Phone Website Traffic To Select Industry Websites, January 2013 [CHART]
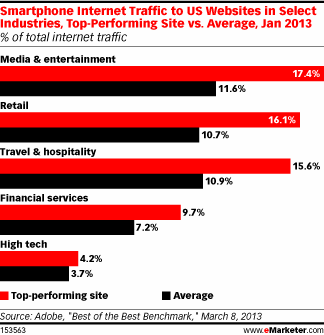
The top-performing site that got the greatest share of traffic from smart phones was in the media and entertainment category.
Read MoreTime Spent On US Websites By Select Industries, January 2013 [CHART]
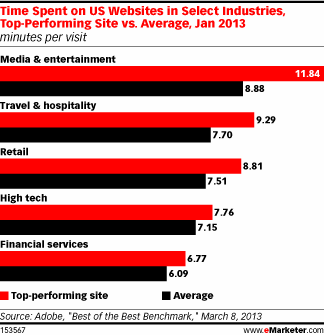
The top-performing media and entertainment site kept users on the site for about 12 minutes per visit.
Read MoreYelp's Filtered Reviews [VIDEO]

Yelp’s video explanation for why they filter reviews.
Read MoreAverage Marketing Budget Growth In 2013 For Select US Industries [CHART]
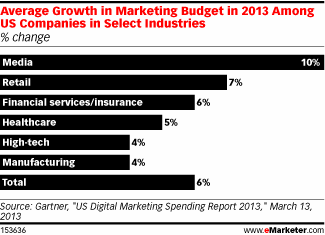
For 2013, marketers are expecting to increase overall marketing budgets by an average of 6%.
Read More