Posts Tagged ‘Retail Marketing’
Daily Deal Purchase Frequency, March 2013 [CHART]
38.2% of US internet users subscribed to at least one daily deal in March 2013, down from 45.3% in September 2011.
Read MoreCollege Students' Multitainment Activities, February 2013 [CHART]
The most popular activity students engaged in while watching TV was using Facebook or Twitter, at 63% of respondents.
Read MoreTop Tech Trends Affecting Retail, June 2013 [CHART]
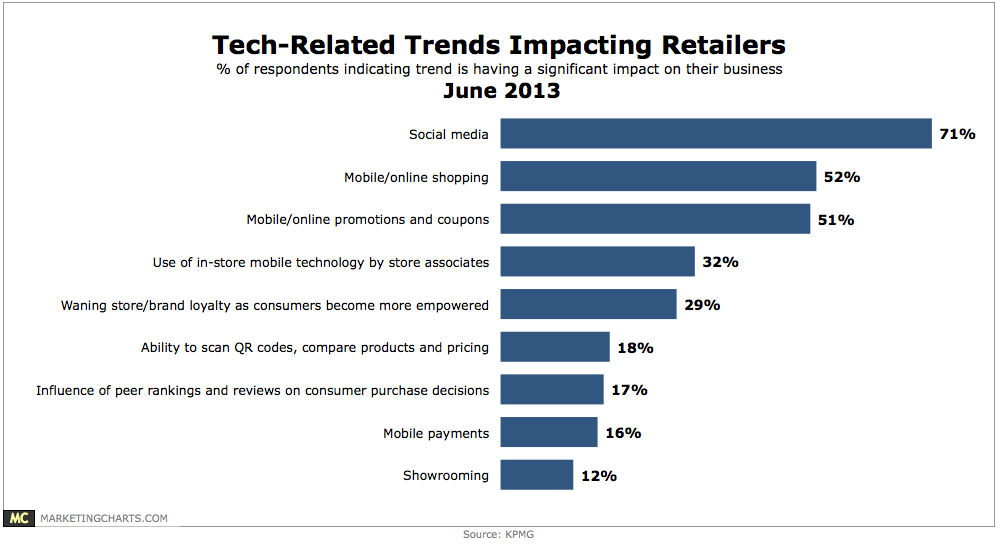
71% of retailers said social media is having a significant impact on their business, with a majority also citing mobile/online shopping (52%).
Read MoreGlobal Facebook Advertising Performance Metrics By Industry, March 2013 [TABLE]
For overall Facebook ads served by industry, sports cost by far and away the most, at a CPM of $9.08.
Read MoreGlobal Facebook Cost Per Like By Industry, March 2013 [TABLE]
General retail and telecommunications had the most success generating page “likes,” at a rate of 0.11% and 0.10%, respectively.
Read MoreImmediate Text Message Marketing Responses By Industry, June 2013 [CHART]
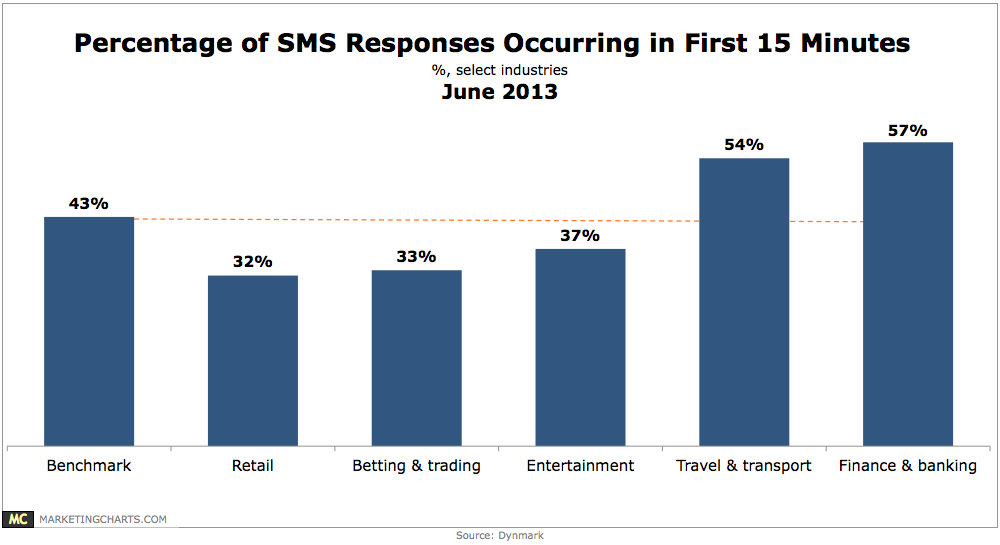
The finance and banking and travel and transport sectors garner quick responses, with 57% and 54% of their responses, respectively, coming in the first 15 minutes.
Read MoreTop In-Stream Video Advertising Verticals, June 2013 [CHART]
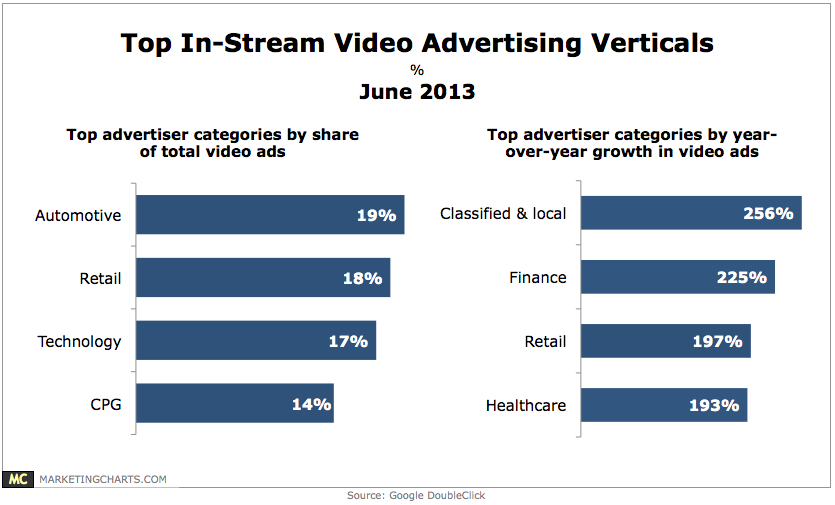
About 2 in 3 in-stream video ad impressions come from 4 advertiser categories.
Read MoreFacebook Ad Performance By Industry, Q1 2013 [CHART]
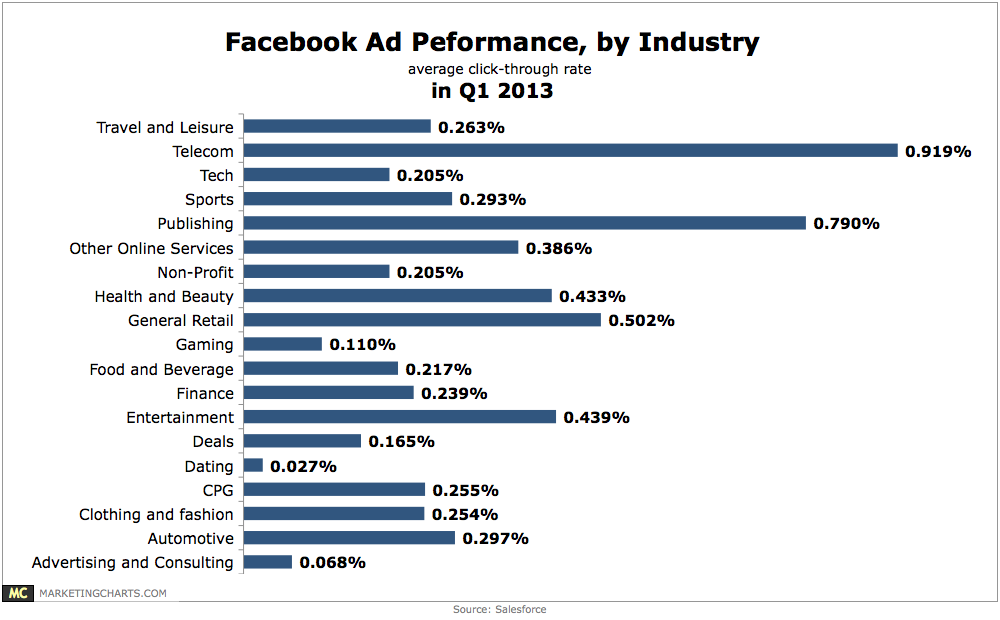
Telecom (0.919%) and publishing (0.79%) brands are leading the charge in Facebook click-through rates.
Read MoreTablet vs. Smart Phone Website Visits For Select Industries, January 2013 [CHART]
Travel not only had the highest percentage of internet traffic coming from tablets at 11.2%, but it was also the only industry studied that actually saw more tablet traffic than smart phone traffic.
Read MoreFacebook Ad Performance By Industry, Q1 2013 [CHART]

Telecom (0.919%) and publishing (0.79%) brands are leading the charge in click-through rates.
Read More