Posts Tagged ‘Publishing’
Subscription Business Churn Rates By Industry [CHART]
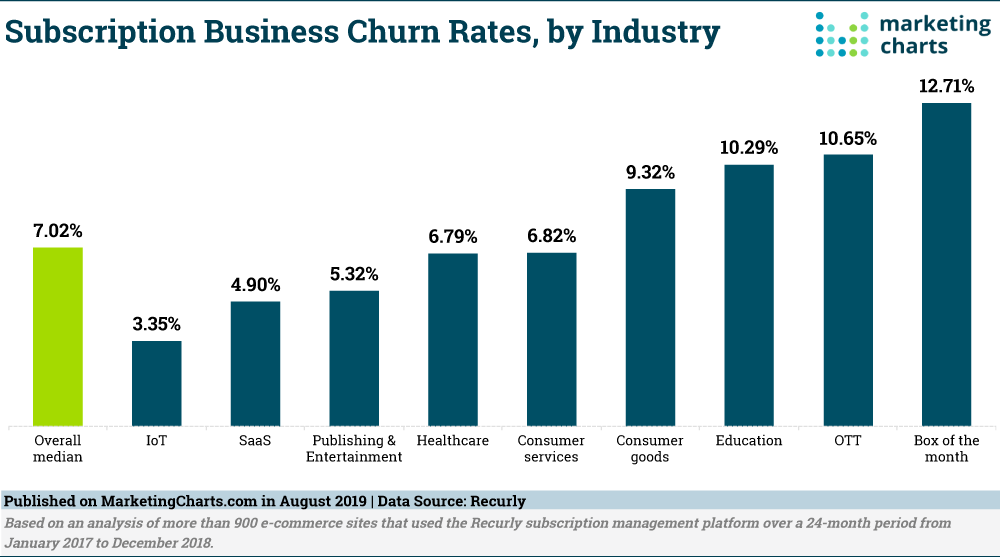
While customers are subscribing to services that provide anything from software, physical products, entertainment to continuing education, they also don’t always stick with those subscriptions.
Read MoreHow News Publishers Use Artificial Intelligence [CHART]
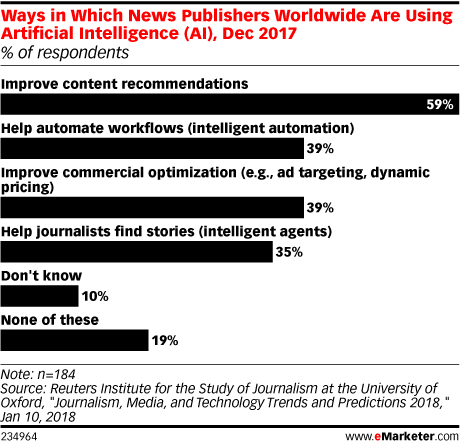
A number of publishers first focused on automating the writing process, with bots creating stories based on structured data such as box scores and financial reports.
Read MoreShare Of Email Clicks By Industry & Device
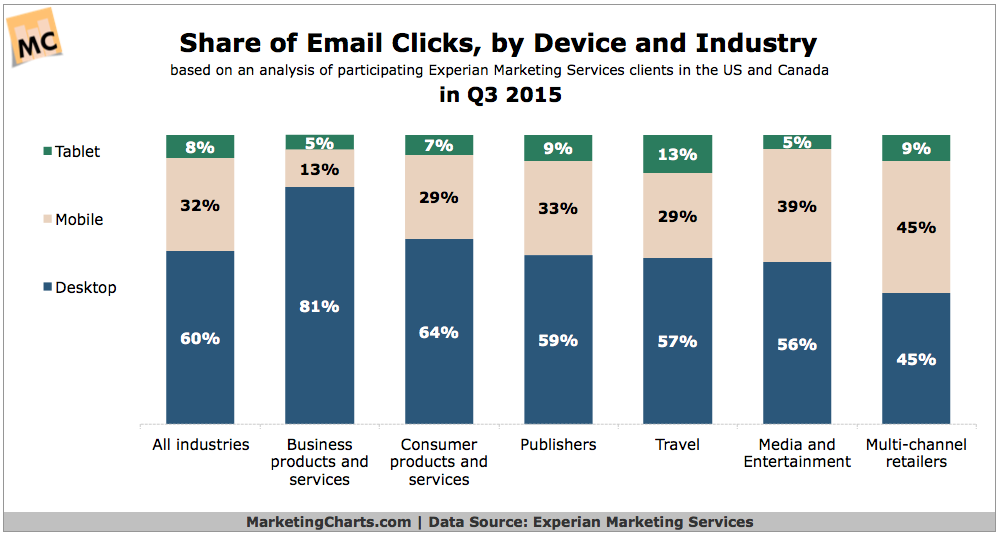
Brands continue to increase their email volume, registering a 24.8% year-over-year rise in Q3.
Read MoreChief Digital Officers By Industry, 2014 [CHART]
CDOs were most common in the advertising industry, which accounted for 36% of the total last year. The media, publishing, nonprofit and retail sectors rounded out the top five.
Read MoreBenchmarks: Global Email Inbox Placement Rates By Industry, September 2014 [CHART]
Some 17% of permissioned emails from legitimate senders around the world failed to reach the inbox during the year-long period from May 2013 to April 2014.
Read MoreEmail Subscriber Activity By Industry, Q2 2014 [CHART]
Yesmail’s analysis of email database subscriber behavior during Q2 shows that just 1.3% of B2B email subscribers were active, the lowest proportion of the industries studied.
Read MoreEmail Click-to-Open Rates By Industry & Device, Q2 2014 [CHART]
Mobile devices accounted for 64.5% of all email opens during the second quarter of this year.
Read MoreEmail Click-To-Open Rates By Industry & Device, Q3 2013 [CHART]
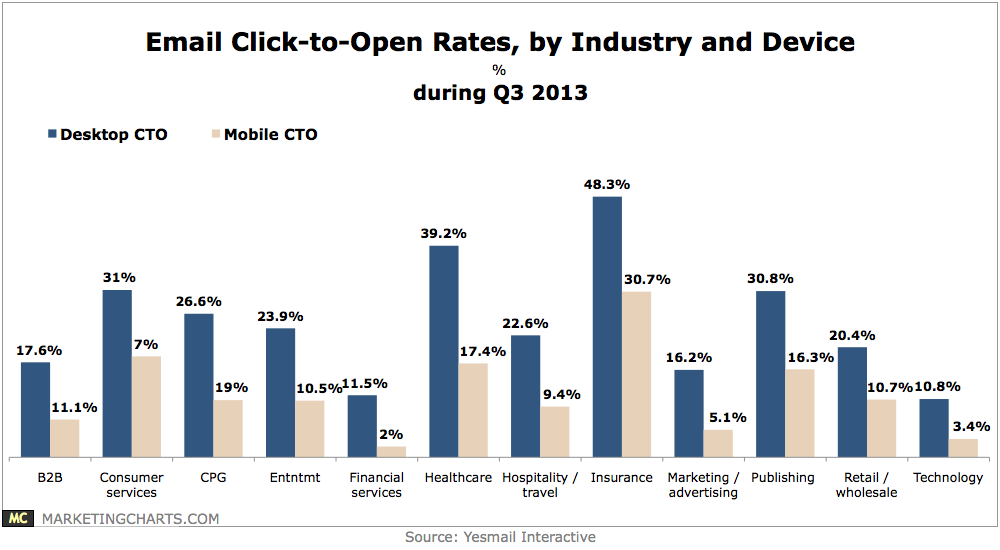
Mobile accounted for a majority 52% of email opens in Q3, up from 49% in Q2.
Read MoreMarketing Email Click-To-Open Rates By Industry & Platform, Q2 2013 [TABLE]
While readers clicked on 23% of emails opened on desktop in Q2 2013 in the US, only 11% did so for emails on mobile.
Read MoreGlobal Facebook Advertising Performance Metrics By Industry, March 2013 [TABLE]
For overall Facebook ads served by industry, sports cost by far and away the most, at a CPM of $9.08.
Read More