Posts Tagged ‘On-Demand Content’
Factors That Influenced TV & VOD Consumption On Alternate Devices, June 2013 [CHART]
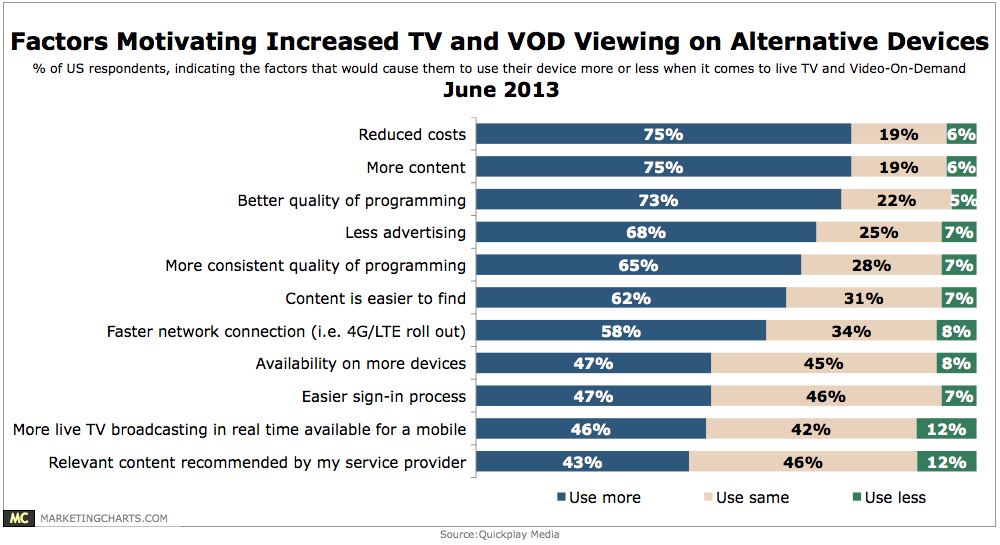
Roughly three-quarters of respondents in the US would be motivated to use their devices more for live TV and VOD viewing on account of reduced cost, more content, and better quality of programming.
Read MoreSubscription On-Demand Video Market Share, Q1 2012 vs Q1 2013 [CHART]
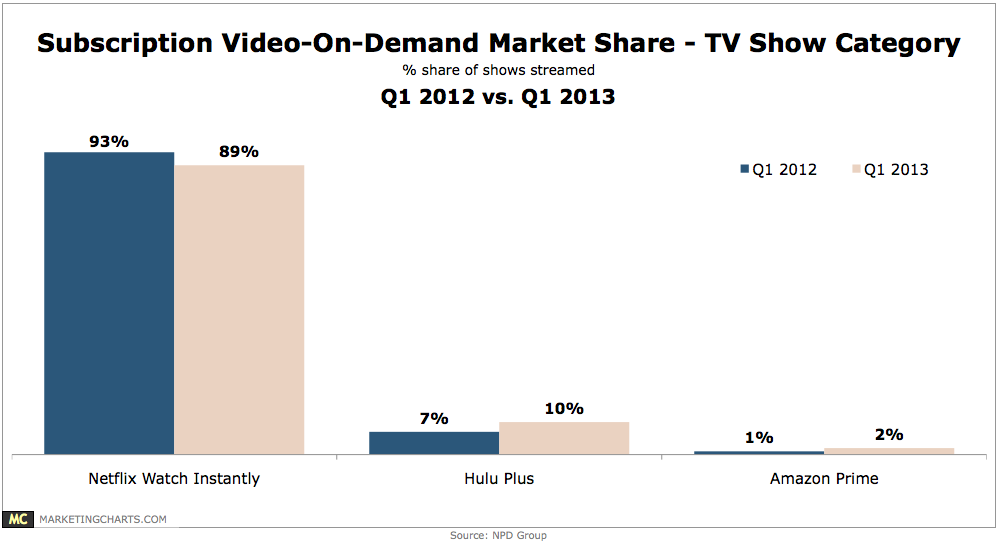
Netflix accounts for almost one-third of North American peak downstream internet traffic.
Read MoreAmericans & On Demand Entertainment, May 2013 [TABLE]
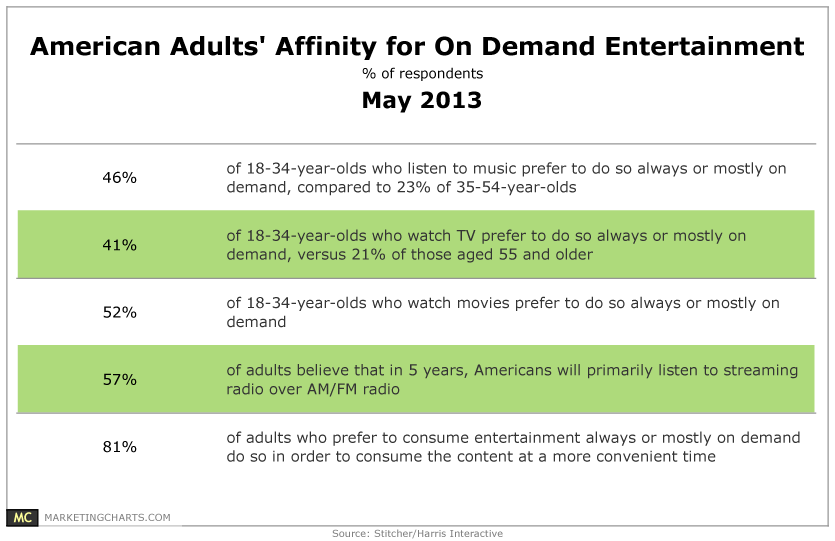
Americans aged 18-34 are more likely than their older counterparts to prefer a range of entertainment types on-demand.
Read MoreHow People Watch TV, May 2013 [CHART]

An average of just 44% of viewing of full-length TV shows is live.
Read MoreVideo On Demand Advertising, April 2013 [CHART]
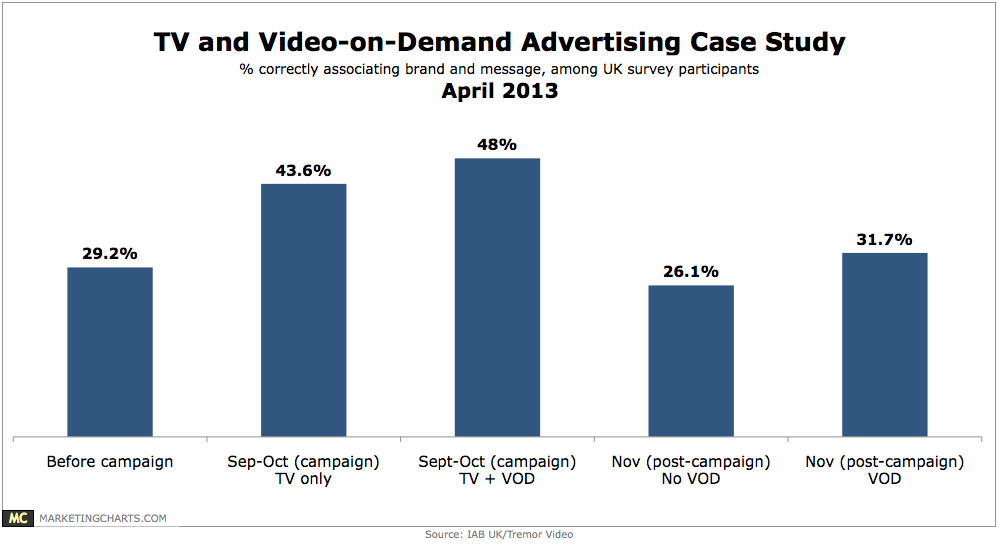
Video-on-demand campaigns can serve as an effective complement to TV advertising, increasing both brand awareness and message association.
Read MoreHow People Binge On TV, February 2013 [CHART]

Most US TV viewers (63%) had used an online subscription service (like Netflix) to binge-view TV.
Read MoreBinge TV Viewing Behavior By Demographic, February 2013 [TABLE]
62% of people watched multiple episodes of a TV show in succession, also known as “binge-viewing.”
Read MoreHow People Watch Time-Shifted TV By Demographic, February 2013 [TABLE]
Nearly eight out of 10 US adult internet users watched TV on their own schedule.
Read MoreOnline Viewership For Broadcast TV, March 2013 [TABLE]
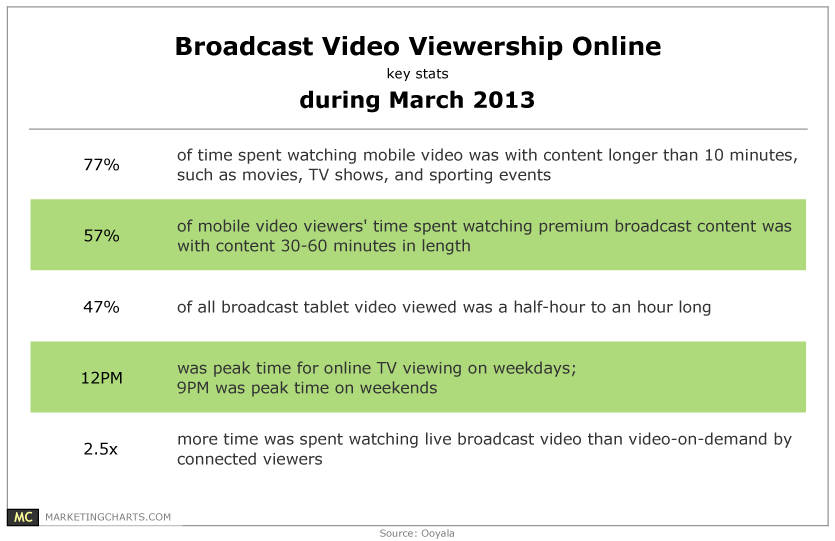
Connected viewers watched live broadcast video 2.5 times longer than video on demand (VOD), while 77% of time spent watching mobile video was with content longer than 10 minutes, such as movies, sporting events, and TV shows.
Read MoreVideo Consumption By Platform & Generation, Q4 2012 [TABLE]
In Q4 2012, seniors averaged 220 hours and 55 minutes per month watching traditional TV.
Read More