Posts Tagged ‘Newspapers’
US Newspaper Subscribers vs. Mobile News Consumers By Age, Q1 2012 & Q1 2013 [TABLE]

Between July 2012 and 2013 and found that the average number of logins to news apps per user rose by 39% year over year.
Read MoreAmericans Who Subscribe To Print Newspapers By Age, Q1 2012 & Q1 2013 [CHART]
The percentage of print subscribers fell just 2.2 percentage points between Q1 2012 and Q2 2013, to 31.1%.
Read MoreAmerican Smart Phone Owners' Primary Sources For Local News, 2013 [CHART]
More than one in four surveyed adult US smart phone owners said they had a news app from a local TV station installed on their phone in 2013.
Read MoreAverage Time Spent Per Day Using Media Channels, 2010-2013 [TABLE]
The average adult will spend over 5 hours per day online, on nonvoice mobile activities or with other digital media this year.
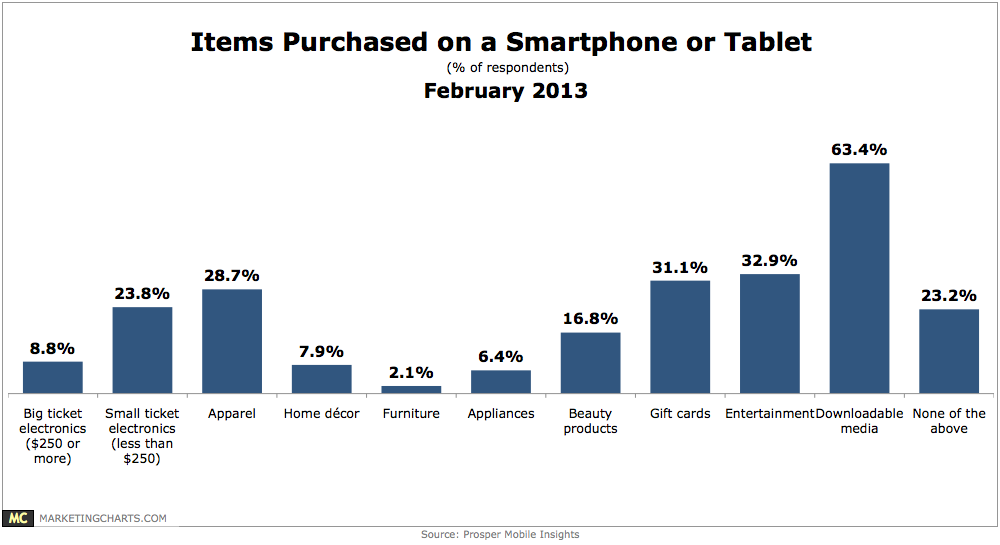
Read MoreAmericans' Small-Ticket Cutbacks, November 2012 vs. June 2013 [CHART]
More Americans are saving money by cutting out small-ticket expenses ranging from print subscriptions to cable TV services.
Read MoreCoupon Users By Source & Age, July 2013 [CHART]
Younger coupon users are more likely than their older counterparts to obtain coupons through social and mobile channels.
Read MoreAmericans' Leading Sources Of News By Media, June 2013 [TABLE]
FOX led the news channels, cited by 8% of respondents, followed by CNN at 7%.
Read MorePreferred Source Of News By Media & Demographic, June 2013 [TABLE]
Those older than 65 and those without a college degree were the most likely to prefer TV news.
Read MorePreferred Media Type For Main News Source By Age, July 2013 [CHART]
Asked their main source of news about current events in the US and around the world, 55% of survey respondents chose TV, with the internet coming in a distant second at 18%.
Read MoreWeekly Media Consumption Of US Boomers & Silent Generation, March 2013 [CHART]
Boomers spent more time on the web than with any other media channel, including TV.
Read More