Posts Tagged ‘Newspapers’
Average Time Spent Per Day By Device, 2010-2014 [TABLE]
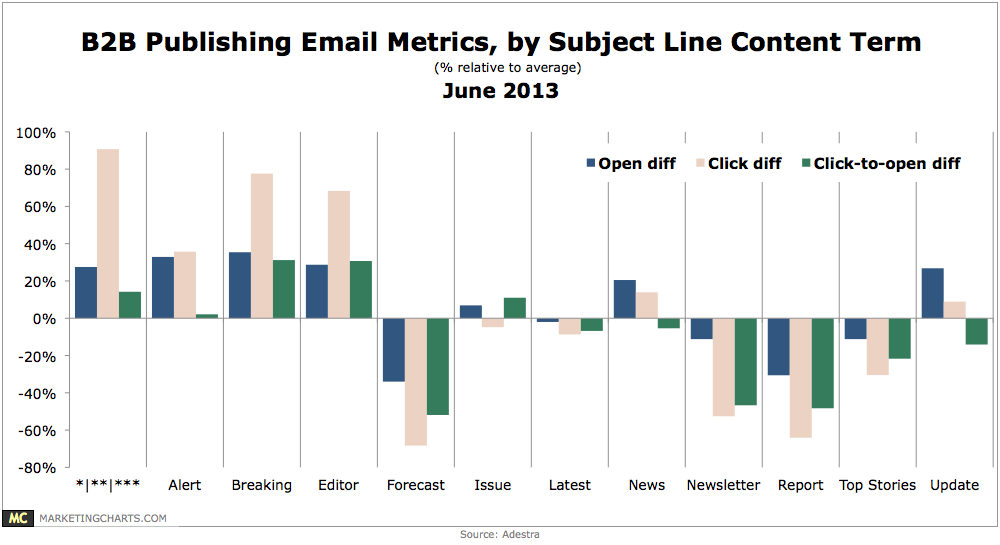
In a marketing world driven ever more by data, content marketing remains very much an art form, especially in the business-to-consumer arena.
Read MoreHow American Adults Spend Their Time Online, 2010 vs 2013 [CHART]
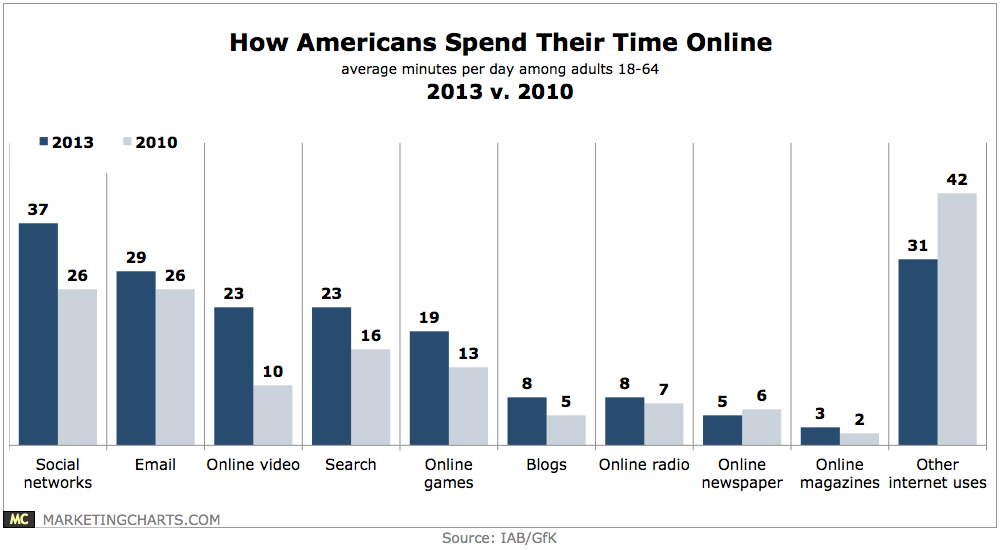
Social networks account for the single largest share of consumers’ time online.
Read MoreChange In Interactions With LGBT Media By US Black LGBT Internet Users, March 2014 [CHART]
Black lesbian, gay, bisexual and transgender (LGBT) internet users in the US are paying more attention to LGBT digital media.
Read MoreGrowth Of Average Daily Time Spent With Major Media, 2011-2014 [TABLE]
US advertisers are only expected to spend 10 cents per US adult per hour spent on digital media this year—and just 7 cents on mobile—compared with nearly $1 on print ads.
Read MoreShare Of Daily Time Spent With Major Media, 2010-2014 [TABLE]
In 2013, time spent with digital media among US adults surpassed time spent with TV for the first time—with mobile driving the shift.
Read More2013 US Newspaper Revenues [CHART]
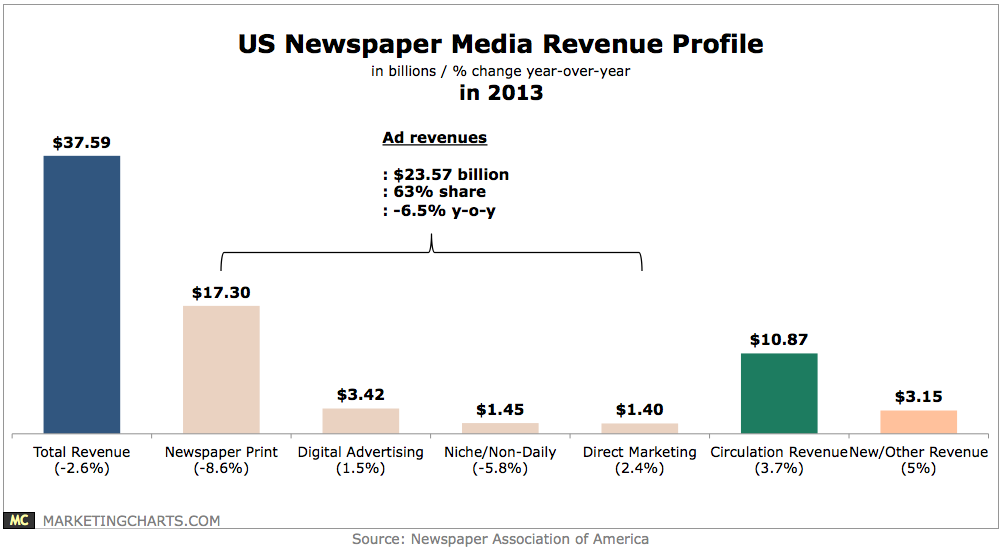
US newspaper cross-platform media revenues shrank by 2.6% year-over-year in 2013 to $37.6 billion.
Read MoreSources Consumers Use For Local Shopping, April 2014 [TABLE]
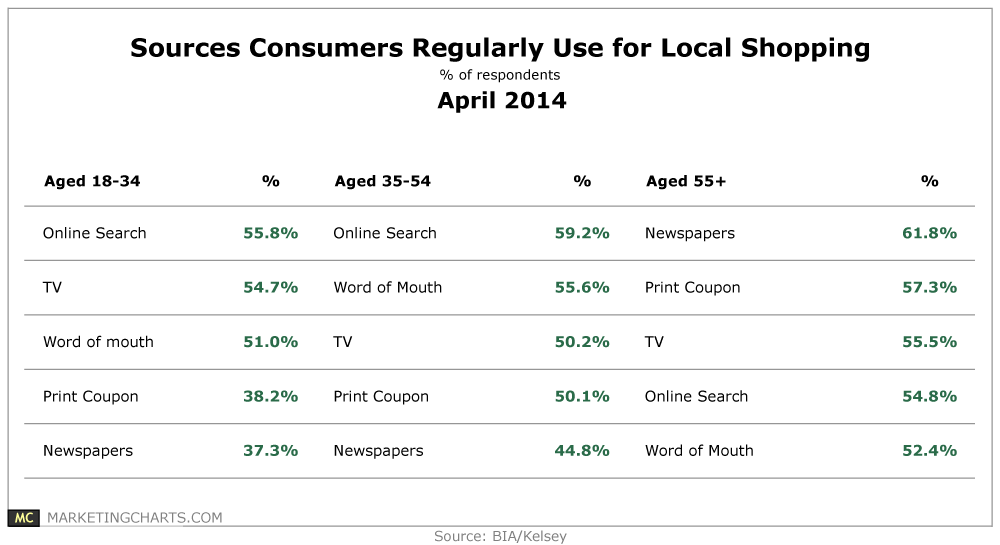
The relative ranking of sources most regularly used by Millennials and Gen X are quite similar, while Baby Boomers still turn to print first.
Read MoreAmericans' Small-Ticket Purchase Cutbacks, April 2014 [CHART]
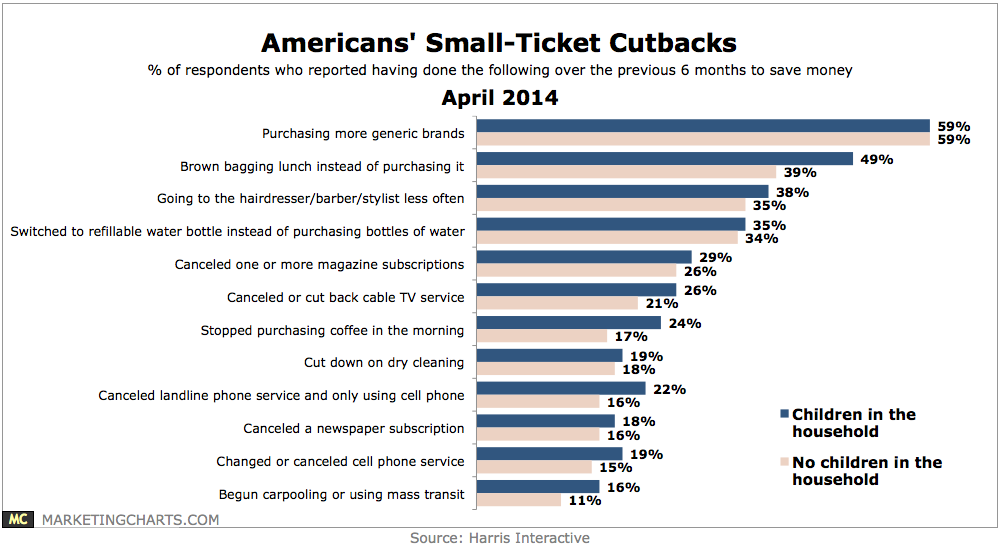
Parents are also more likely than those without children in the household to decrease their spending in a variety of areas, including restaurants (64% vs. 56%) and entertainment (60% vs. 51%).
Read MoreAmericans' Paid News Subscriptions, February 2014 [CHART]
Just one-quarter of US consumers said that they currently paid for at least one news subscription.
Read MoreMedia Gender Gap [INFOGRAPHIC]
Male journalists make up 63% of bylines in print, Internet and wire news media, according to a recent report from the Women’s Media Center.
Read More