Posts Tagged ‘Newspapers’
Americans' Daily Time Spent With Online Media, 2010-2012 [TABLE]
Last year, social networks occupied 37 minutes of the average US consumer’s time per day, up considerably from 30 minutes per day in 2011.
Read MoreHow People Find Websites, 2011 vs. 2012 [CHART]
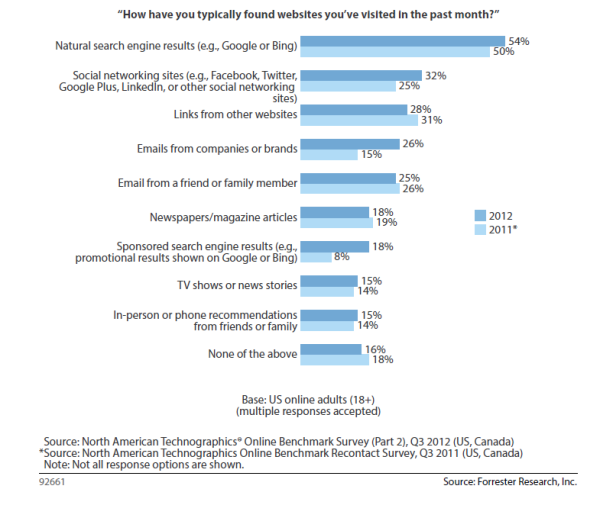
54% of respondents found websites through natural search results in 2012, up from 50% in 2011.
Read MoreUS Traditional Media Revenue Outlook, 2013-2017 [CHART]
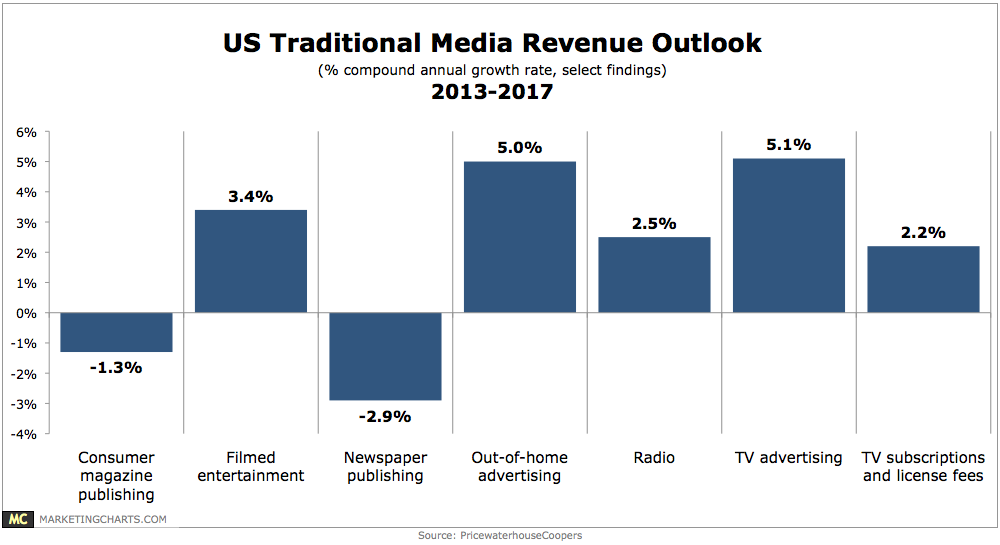
PwC has issued its annual “Entertainment & Media Outlook” report, which contains projections for online and offline media markets through 2017.
Read MoreNewspaper Circulation & Advertising Trends By Region, 2012 [CHART]
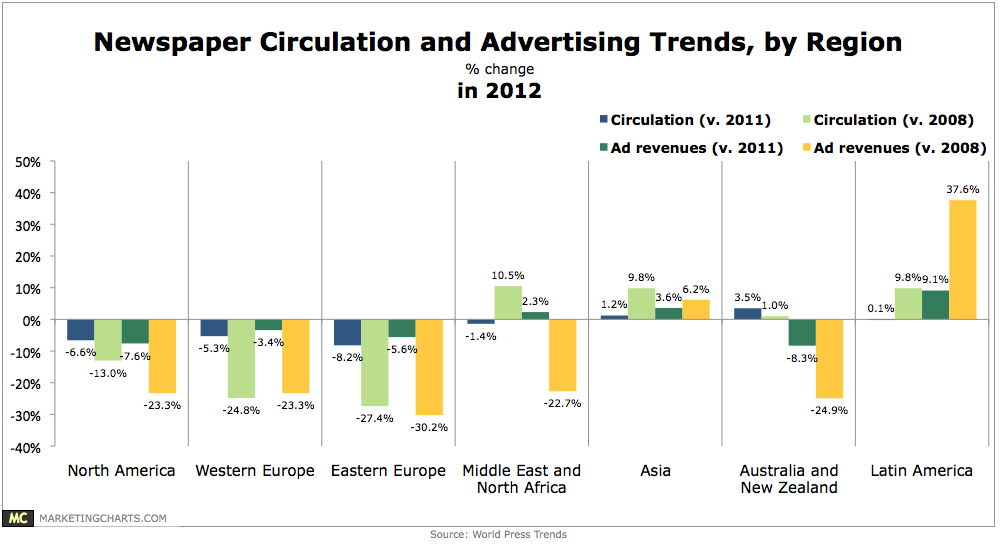
Newspaper circulation around the world dropped by only 0.9% in 2012, as losses in North America and other regions were almost completely offset by gains in Asia.
Read MoreAccepting Advertising For Free Content, May 2013 [CHART]
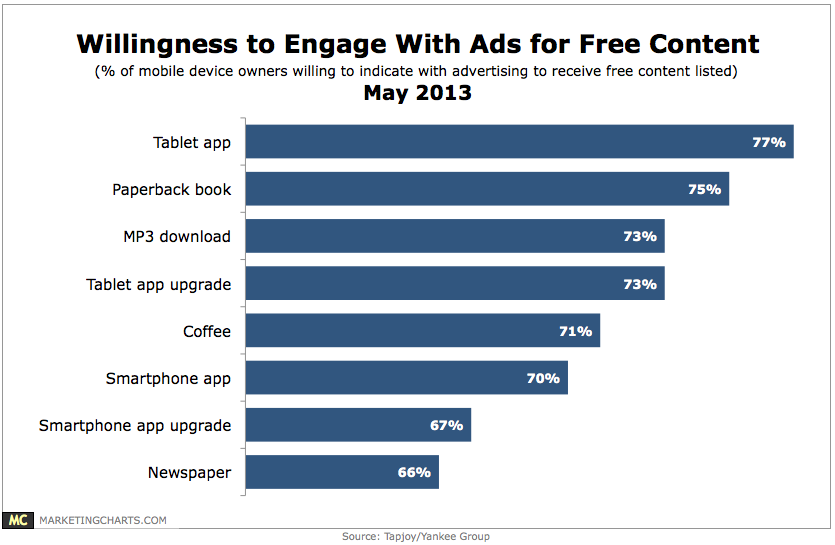
Mobile device owners would prefer to spend time engaging with advertising in order to receive free content, whether that be a tablet (77%) or smartphone (70%) application, or even a newspaper (66%).
Read MoreLocal Media Fans Social Behaviors By Media Type, May 2013 [CHART]
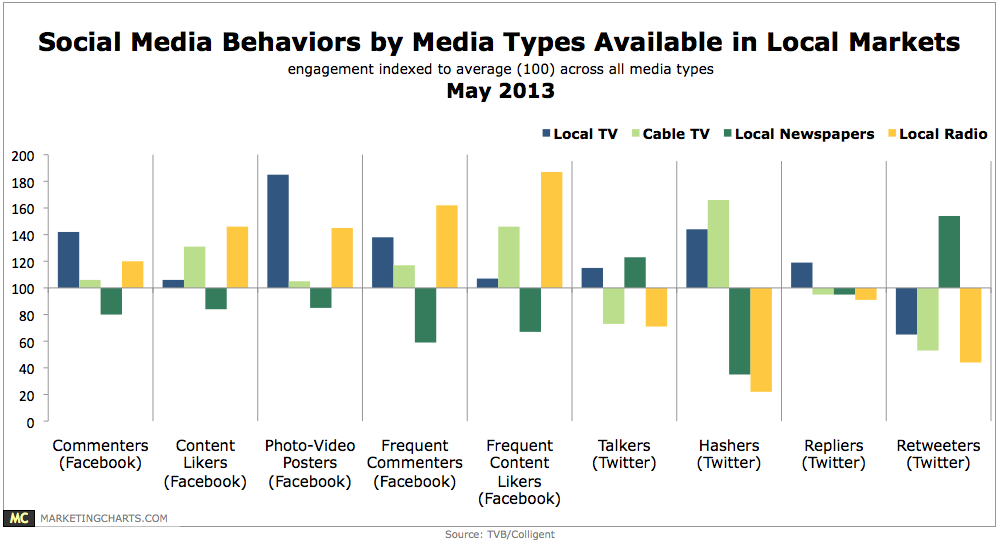
What kind of social behaviors do local media fans exhibit on Facebook and Twitter? It depends on the medium.
Read MoreTop Local Markets For Digital Media Use, 2012 [TABLE]
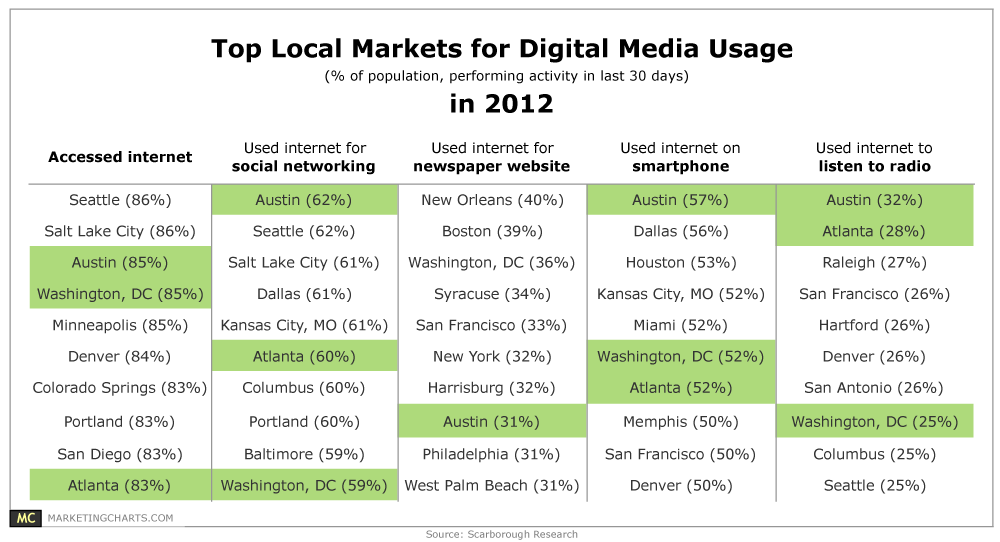
Use of the internet for social networking was highest in Austin and Seattle (62% of each market’s population in the 30 days prior to the survey), while New Orleans topped the charts for newspaper website access (40%).
Read MoreNewspaper Revenue Trends, 2011 vs 2012 [TABLE]
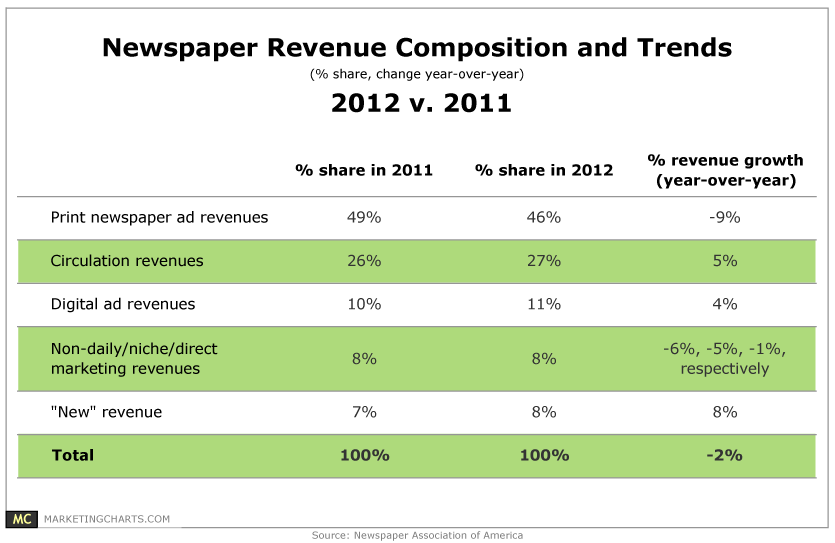
Newspaper ad revenues dropped by 6% last year, marking the 7th consecutive year of declines after a 7.3% fall last year.
Read MoreAmericans' Daily Media Consumption, 2012 vs 2013 [CHART]
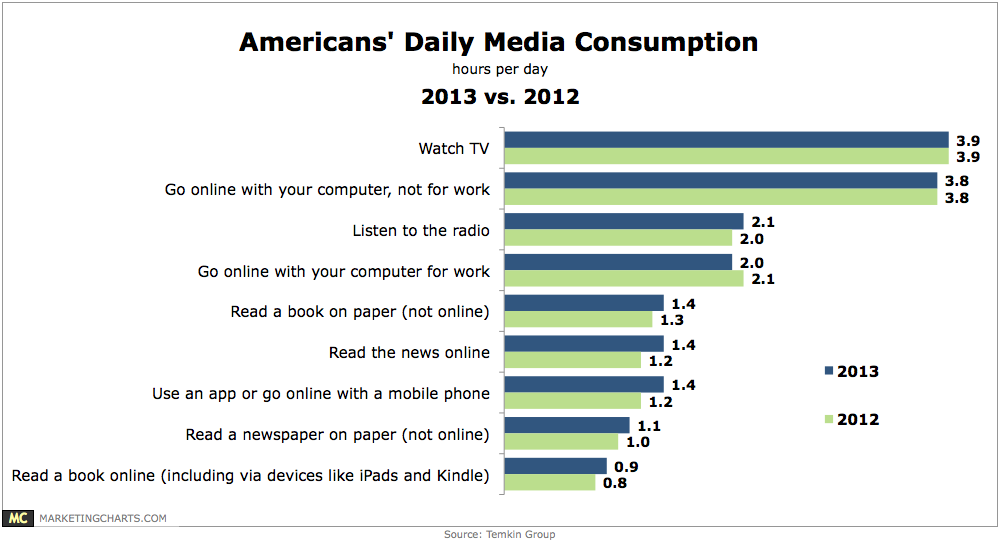
Americans are holding steady in terms of their TV consumption and non-work-related internet use, but are spending more time with other activities such as reading books and accessing the internet via a mobile device.
Read MoreAmericans’ Favorite Media Activities By Generation, March 2013 [CHART]

64% of Americans rank watching TV (on any device) as one of their top-3 media activities, down from a high of 71% in 2009 and 2010 but enough to keep TV viewing as America’s favorite media activity.
Read More