Posts Tagged ‘Movie Marketing’
Teen Spending Behavior, April 2013 [TABLE]
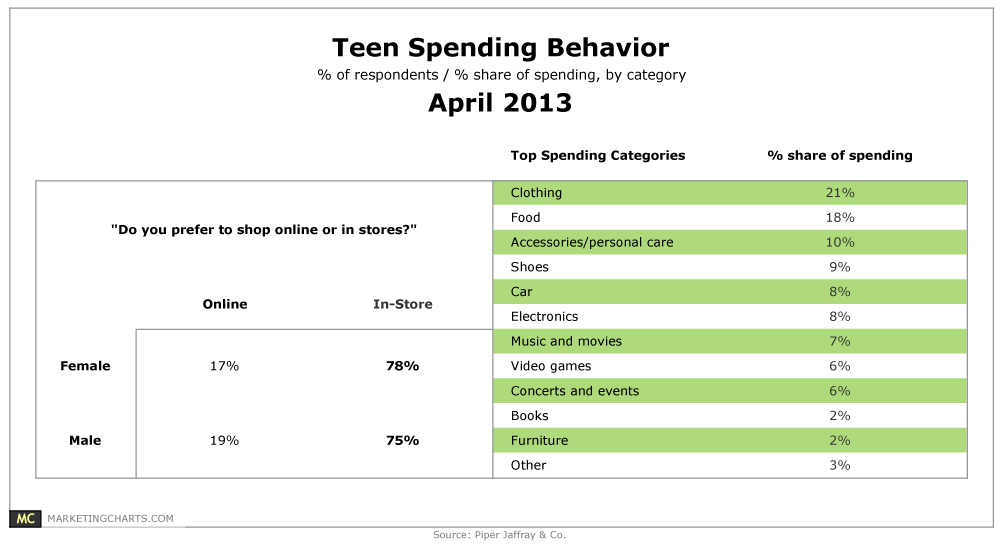
More than 3 in 4 teens shop online.
Read MoreAmerican & Retail Therapy, April 2013 [TABLE]
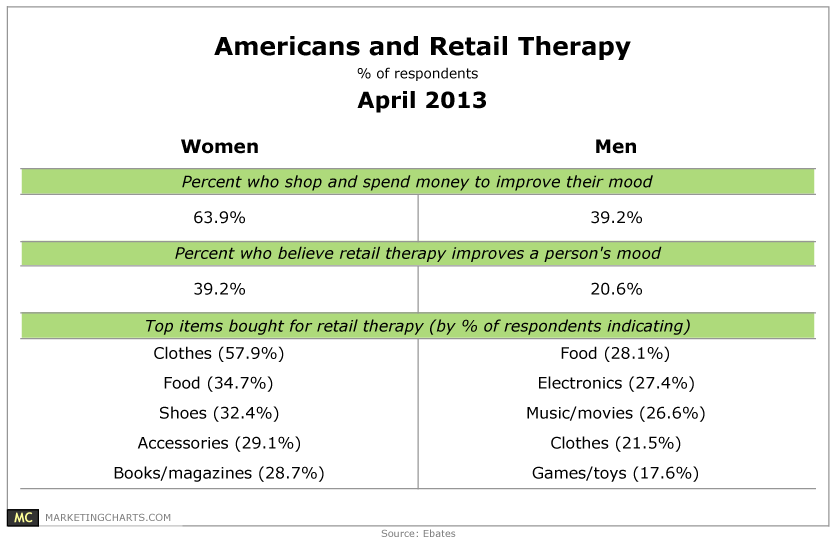
American women are 61% more likely than men to say they shop and spend money to improve their mood.
Read MoreDigital TV & Movie Viewers, 2012-2017 [CHART]

The number of US digital TV viewers will reach 145.3 million in 2017, up from 106.2 million in 2012.
Read MoreAmericans’ Favorite Media Activities By Generation, March 2013 [CHART]

64% of Americans rank watching TV (on any device) as one of their top-3 media activities, down from a high of 71% in 2009 and 2010 but enough to keep TV viewing as America’s favorite media activity.
Read MoreActivities Performed On Computers vs. Tablets vs. Smart Phones [CHART]
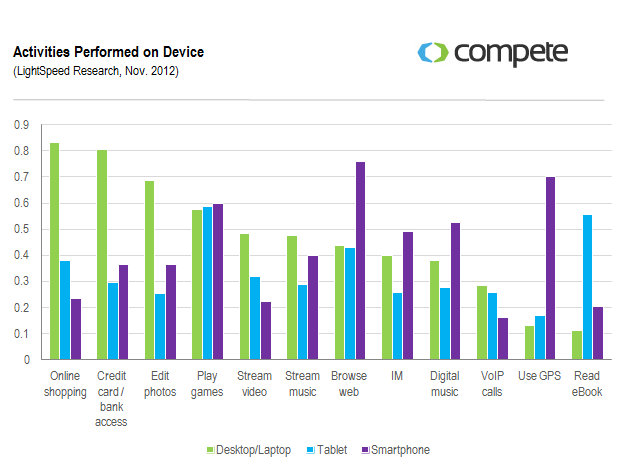
45% of consumers who use their mobile devices to shop report using the device to compare prices.
Read MoreUse Of Game Consoles To Stream Video, 2010-2012 [CHART]
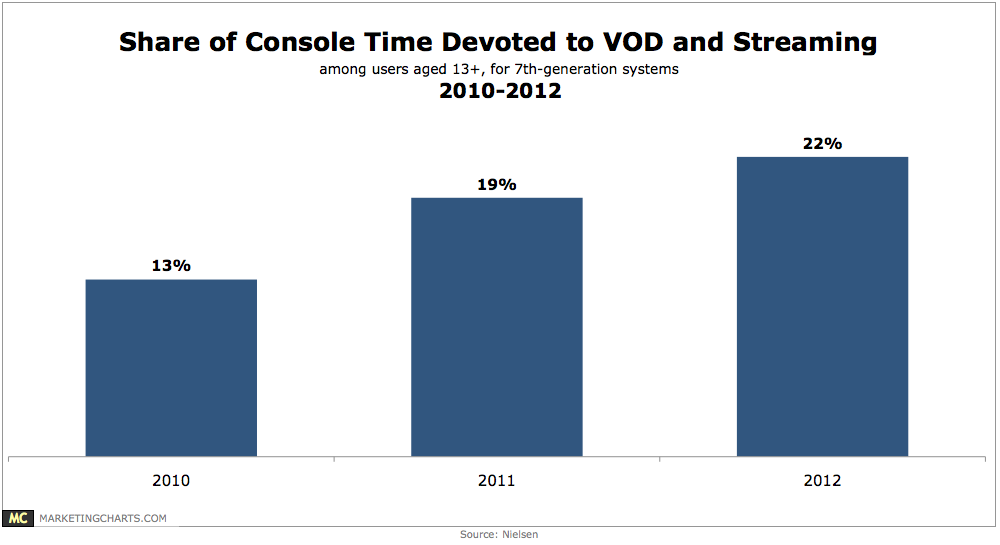
Americans still use their game consoles mostly for playing video games, but video on-demand (VOD) and streaming services are capturing more of console usage time.
Read MoreTypes Of Streamed Mobile Video By Device, January 2013 [CHART]
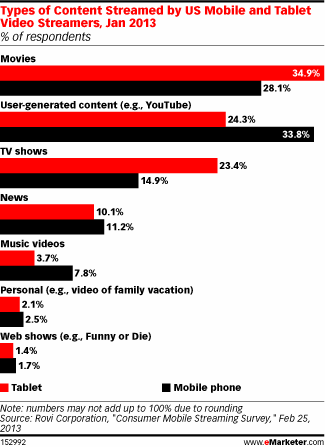
The top three kinds of content for both smart phone & tablet users were movies, user-generated content (such as YouTube videos) and TV shows.
Read MoreOscars 2013 Social TV Chatter On Facebook [INFOGRAPHIC]
This infographic by Facebook illustrates some of the Social Television chatter that occurred during the Oscars broadcast.
Read MoreAmericans' Most Popular Movie Genres [CHART]
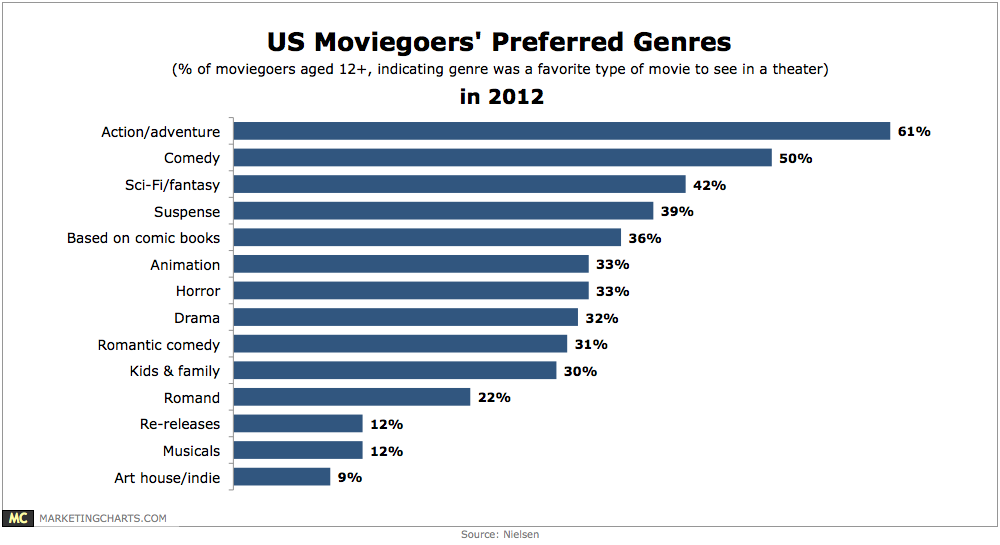
Asked the types of movies they like to see most in theaters, 61% of American moviegoers chose action and adventure flicks, with comedy (50%) rating as the second-most popular.
Read MoreSearch Volume & Social Chatter For Best Picture Oscar Nominees [CHARTS]

Online behavior for Amour, Argo, Beasts of the Southern Wild, Django Unchained, Les Misérables, Life of Pi, Lincoln, Silver Linings Playbook & Zero Dark Thirty.
Read More