Posts Tagged ‘Mobile Video’
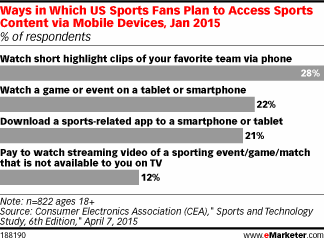
How Sports Fans Consume Mobile Content, January 2015 [CHART]
While a decent 40% of respondents had checked out sports digitally, just 16% had consumed content through a mobile device in the past 12 months.
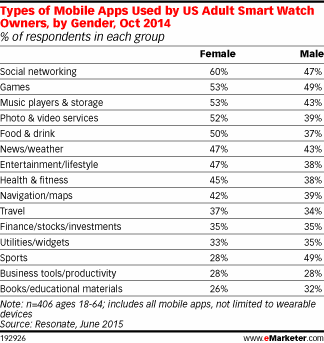
Read MoreMost Popular Smart Watch Apps By Gender, October 2014 [TABLE]
Most Popular Smart Watch Apps By Gender: Women liked social networking apps the best while men liked sports and gaming apps best.
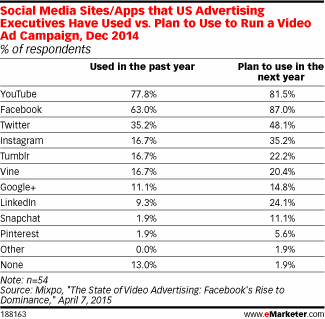
Read MoreSocial Sites That Ad Execs Have Used vs. Plan To Use For Video, December 2014 [TABLE]
Nearly nine in 10 US advertising executives polled said they planned to run a video ad campaign on Facebook in the coming year—the highest response rate out of all networks.
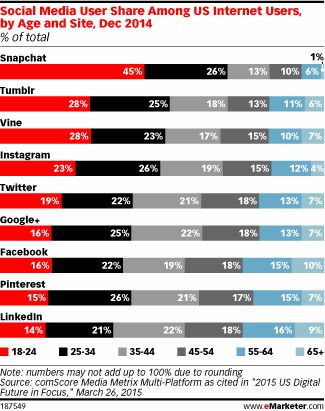
Read MoreSocial Network Usage Share By Site & Age, December 2014 [CHART]
This year, 95.0% of 18-to-24-year-old internet users in the US will log on to a social network via any device at least once per month.
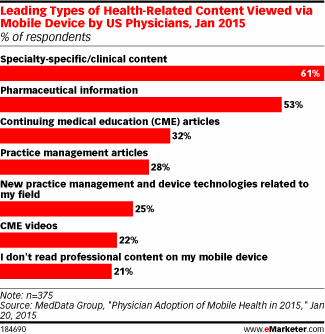
Read MoreTop Mobile Content Consumed By Physicians
Specialty-specific or clinical content was the leading type viewed via mobile by US physicians.
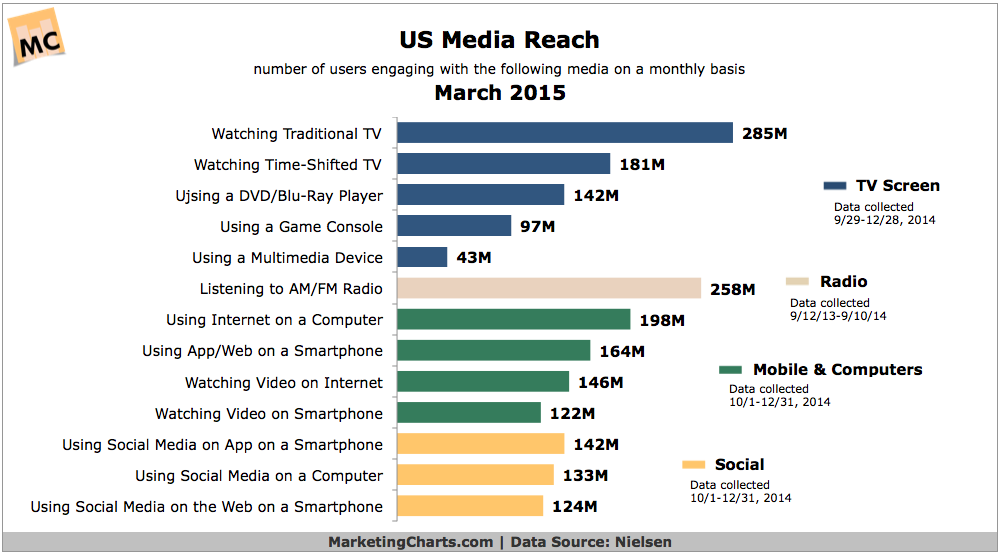
Read MoreUS Media Reach By Channel, March 2015 [CHART]
Some 142M Americans use social media applications on smartphones on a monthly basis, slightly higher than the number using social media on a computer 133 M.
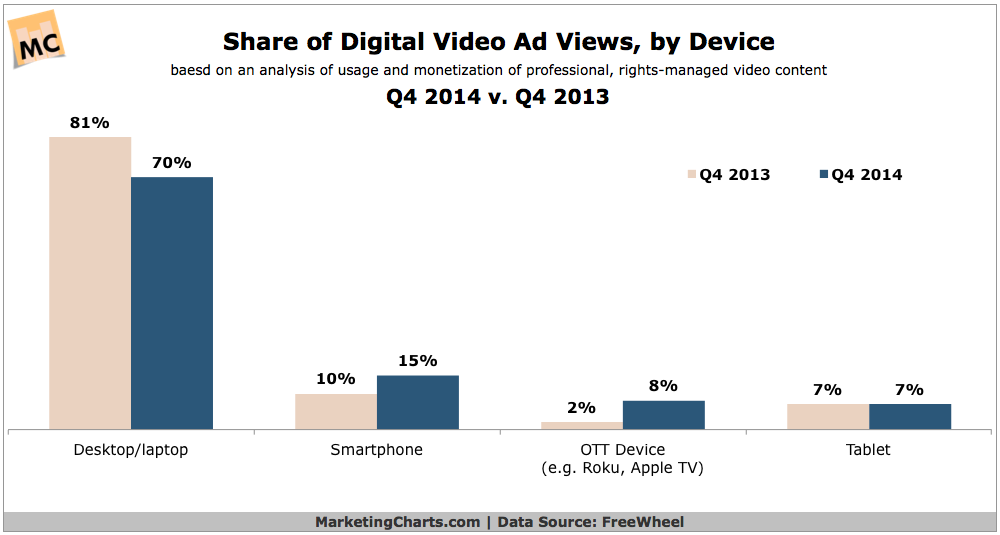
Read MoreShare Of Video Ad Views By Device, 2013 vs 2014 [CHART]
Tablets are popular devices for video viewing but OTT streaming devices such as Apple TV and Chromecast have moved ahead in digital video monetization.
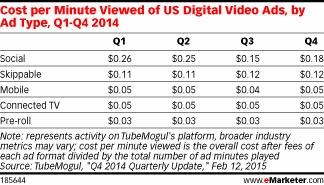
Read MoreCost Per Minute Viewed Of Video Ads, 2014 [TABLE]
The average weekly cost per minute viewed for pre-roll ads was 3.2 cents in Q4 2014—the lowest price.
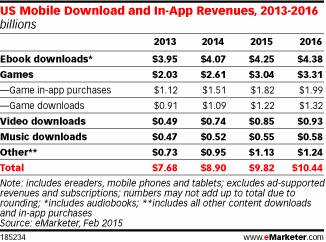
Read MoreMobile Downloads & In-App Revenues, 2013-2016 [TABLE]
Ebook sales will reach $4.25 billion in 2015, accounting for 43.3% of US mobile download and in-app revenues in 2015.
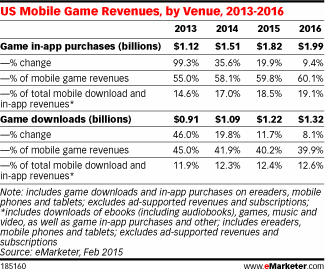
Read MoreMobile Game Revenues By Venue, 2013-2016 [TABLE]
Mobile content revenues in the US will total $9.82 billion in 2015, a 10.3% increase from 2014.
Read More