Posts Tagged ‘Mobile Video’
mCommerce Activities Of Affluent Americans By Device, April 2013 [TABLE]
Among US internet users ages 21 and older earning more than $150,000, more than eight in 10 owned a smart phone, while 56% reported owning a tablet.
Read MorePreferred Television Genres By Viewing Device, June 2013 [CHART]
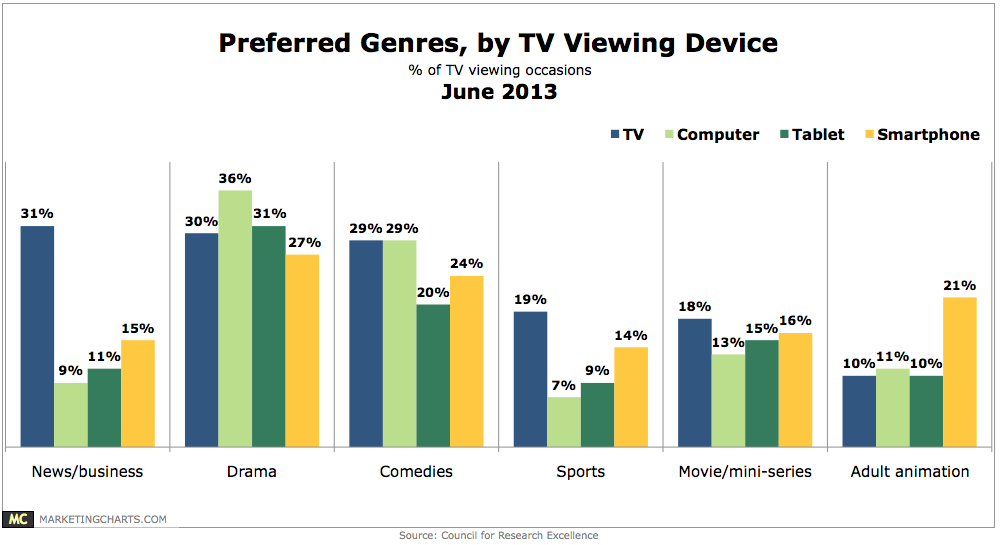
On the traditional TV, news and business (31%) got the edge on drama (30%) and comedies (29%) as the top genres by percentage of viewing occasions.
Read MoreTV Viewing Times By Device, June 2013 [TABLE]
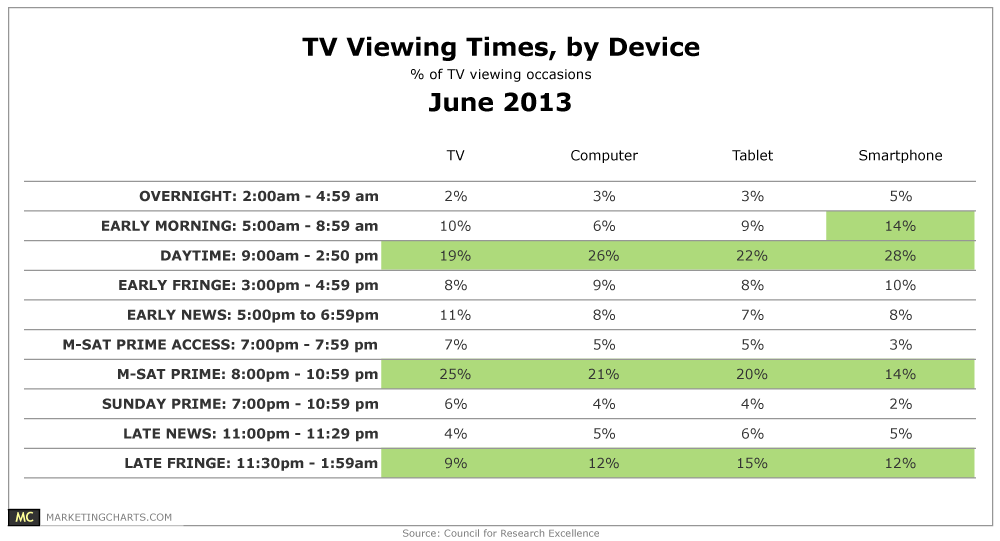
A plurality of tablet (22%) and smart phone (28%) TV viewing occasions tracked occurred during the daytime, between 9 AM and 3 PM.
Read MoreMobile & Tablet Video Ad Views By OS, Q1 2013 [CHART]
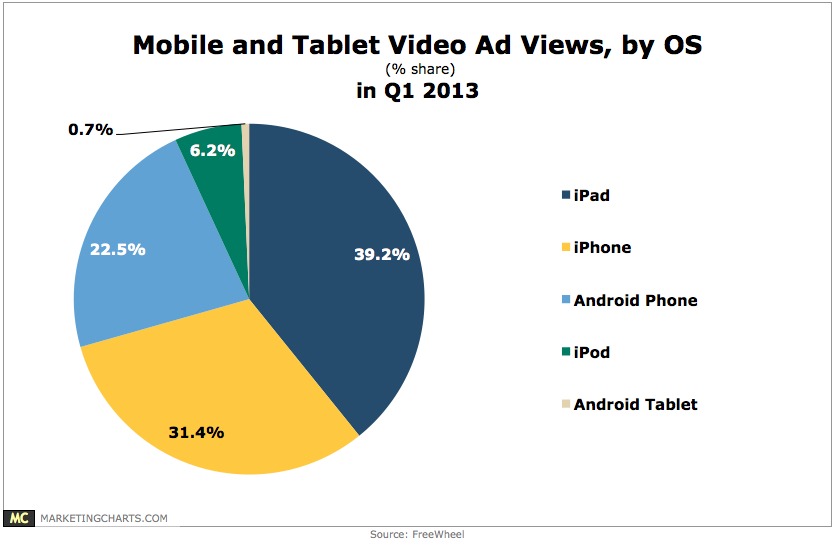
More mobile video ad views took place on an iPhone (31.4% share of mobile and tablet ad views) than an Android phone (22.5% share) in Q1.
Read MoreMobile Video Discovery Methods, May 2013 [CHART]
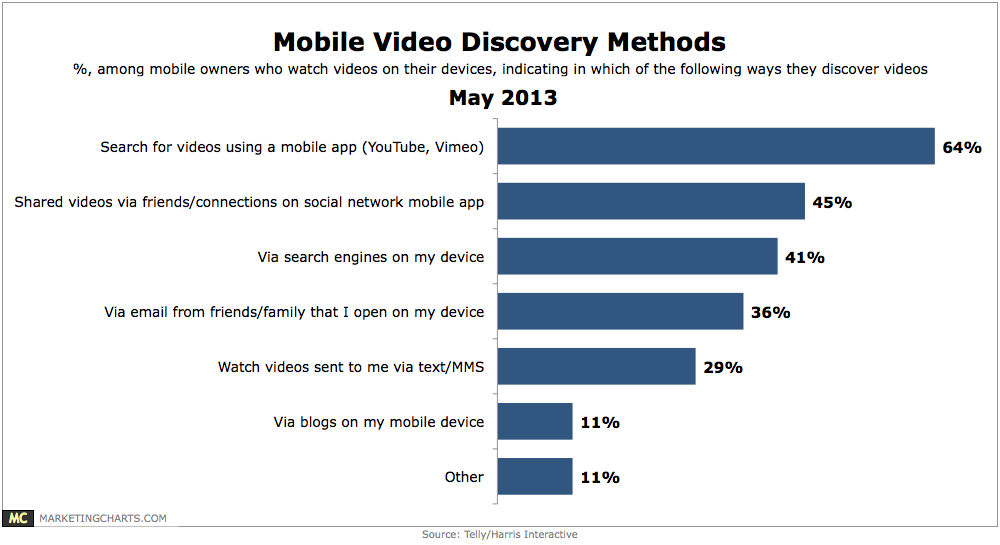
35% of mobile device owners watch videos on their device.
Read MorePercent Of Viewing Time Spent Using Tablets By Generation, May 2013 [CHART]
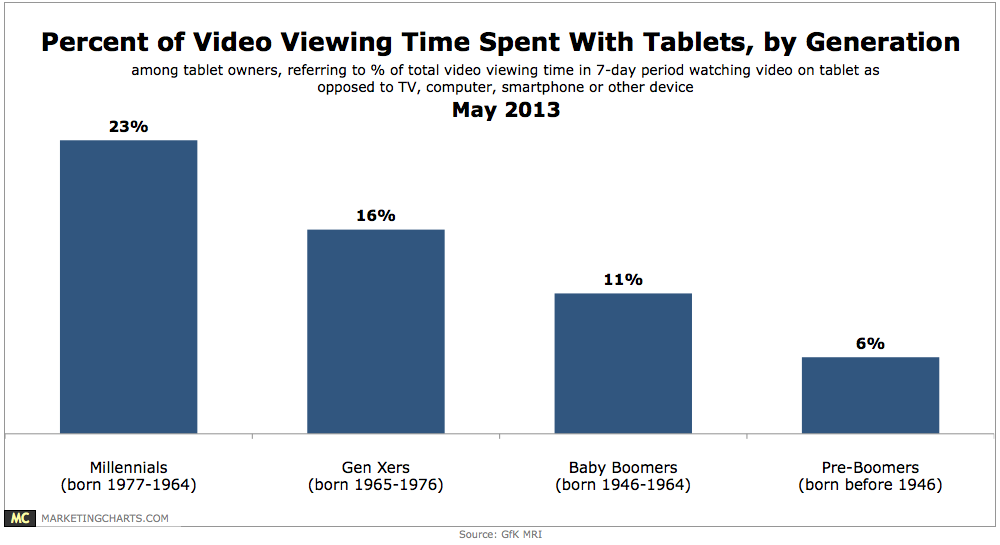
Among tablet owners, Millennials (born 1977-1994) spend on average 23% of their total video viewing time (time spent watching video on any device, including TV, in a 7-day period) with their devices.
Read MoreTop Features Implemented On American Small Business Mobile Websites, March 2013 [CHART]
Of the 1/3 of small businesses that had optimized their websites for mobile, 70% had made the effort to also ensure their sites worked well with social media.
Read MoreChange In Facebook Users' Activities By Device, Q1 2013 [TABLE]
Watching videos on Facebook saw among the biggest jumps in usage, with viewing increasing by 47% on both PC and mobile, and nearly doubling on the tablet.
Read MoreHow People Watch TV, May 2013 [CHART]

An average of just 44% of viewing of full-length TV shows is live.
Read More