Posts Tagged ‘Mobile TV’
Top Reasons People Don't Watch Mobile TV, July 2015 [CHART]
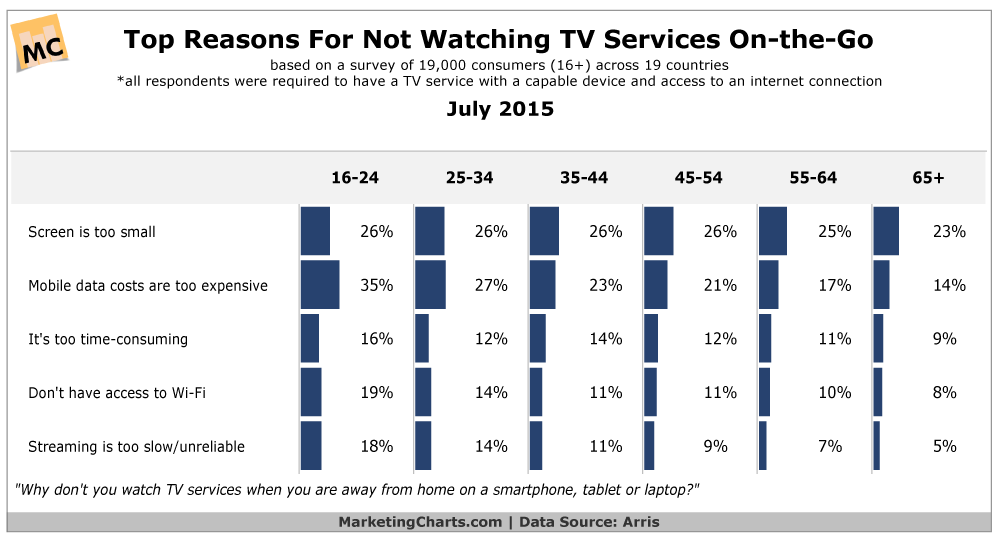
Mobile TV – defined as watching TV services while away from home on a smartphone, tablet or laptop – is growing in frequency.
Read MoreTV Viewing On Alternative Devices, 2012-2014 [CHART]
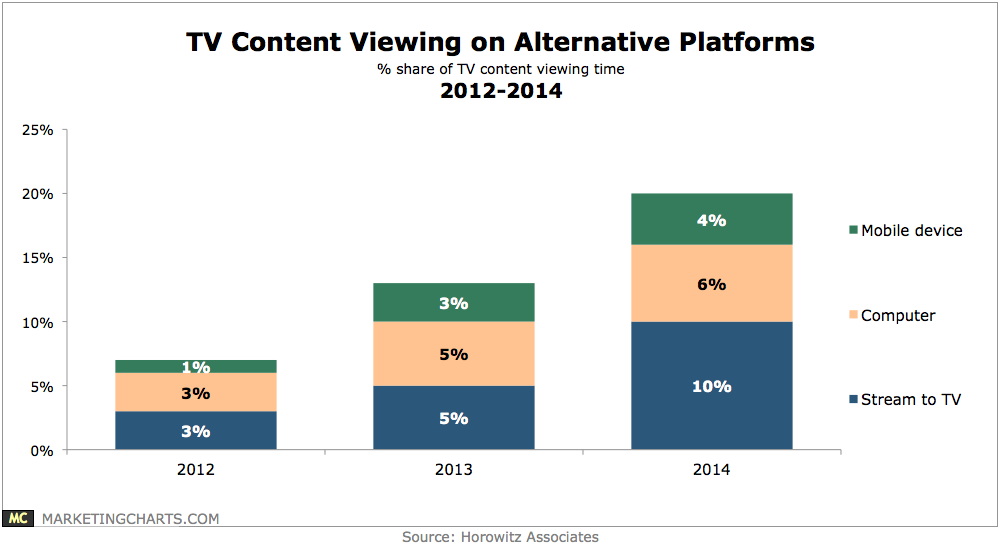
The 20% of TV content viewing time spent on alternative platforms is a significant step up from 13% last year, with the biggest change being for streaming to the TV set (10% this year, up from 5%).
Read MoreTypes Of Mobile Video Content, March 2014 [CHART]
About 6 in 10 smrt phone users said they rarely (20.6%) or never (39.7%) watch TV shows, movies, or video content on their device during the average week.
Read MoreStreaming TV & Movies At Home vs Out Of Home By Device, September 2013 [CHART]
One-quarter of internet users reported using their smartphones to watch streaming TV and movies while on the go, and nearly as many said the same about tablets.
Read MoreGeneration V's Daily Time Spent With Media By Device, 2011 & 2013 [TABLE]
Younger children are spending less time overall in front of screens, according to an October 2013 survey of US parents with kids ages 8 and younger.
Read MoreValue Of Live Anywhere Pay-TV, October 2013 [CHART]
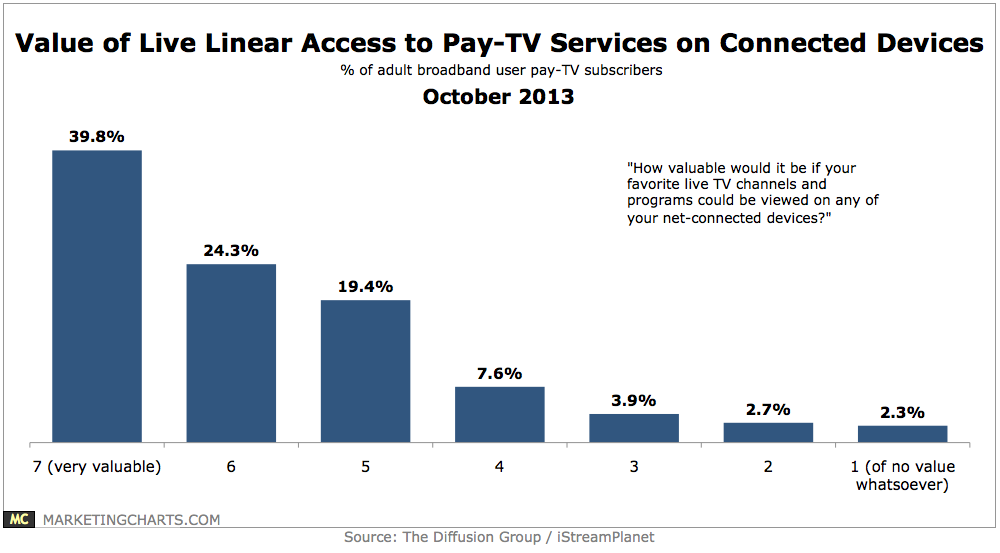
Among adult pay-TV subscribers who also use a home broadband service, more than 8 in 10 feel that the ability to view live TV channels and programs on any net-connected device would be valuable.
Read MoreMost Desirable Future TV/Video Services & Options, September 2013 [CHART]
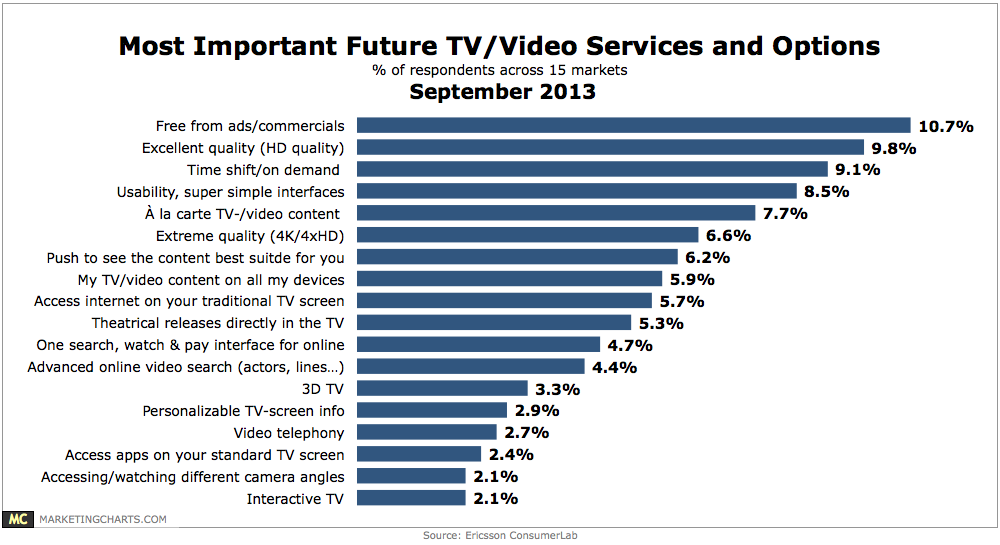
A leading 10.7% share of TV viewers from around the world said they want their future TV experience to be free of ads.
Read MoreWhere Americans Watch TV By Device, January 2013 [TABLE]
While smart mobile device users can now watch TV from anywhere, they still favor sitting at home to watch their shows.
Read MoreTelevision Consumption By Device, June 2013 [CHART]
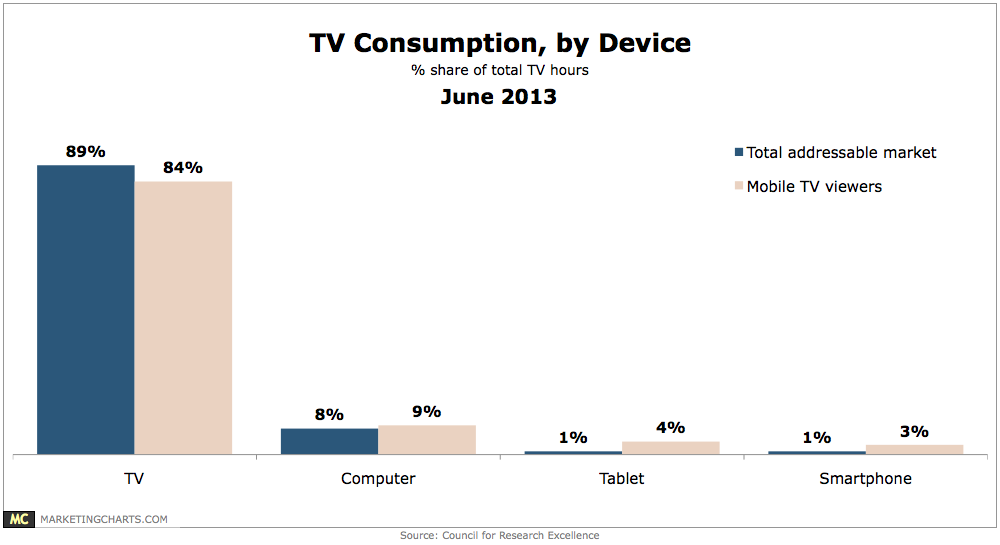
Just 2% of all TV hours logged were on tablets (1%) or smart phones (1%).
Read MoreHow People Watch TV, May 2013 [CHART]

An average of just 44% of viewing of full-length TV shows is live.
Read More