Posts Tagged ‘Mobile Social’
Top Features Implemented On American Small Business Mobile Websites, March 2013 [CHART]
Of the 1/3 of small businesses that had optimized their websites for mobile, 70% had made the effort to also ensure their sites worked well with social media.
Read MoreChange In Facebook Users' Activities By Device, Q1 2013 [TABLE]
Watching videos on Facebook saw among the biggest jumps in usage, with viewing increasing by 47% on both PC and mobile, and nearly doubling on the tablet.
Read MoreFacebook's Mobile Monthly Active Users, Q4 2010-Q1 2013 [CHART]
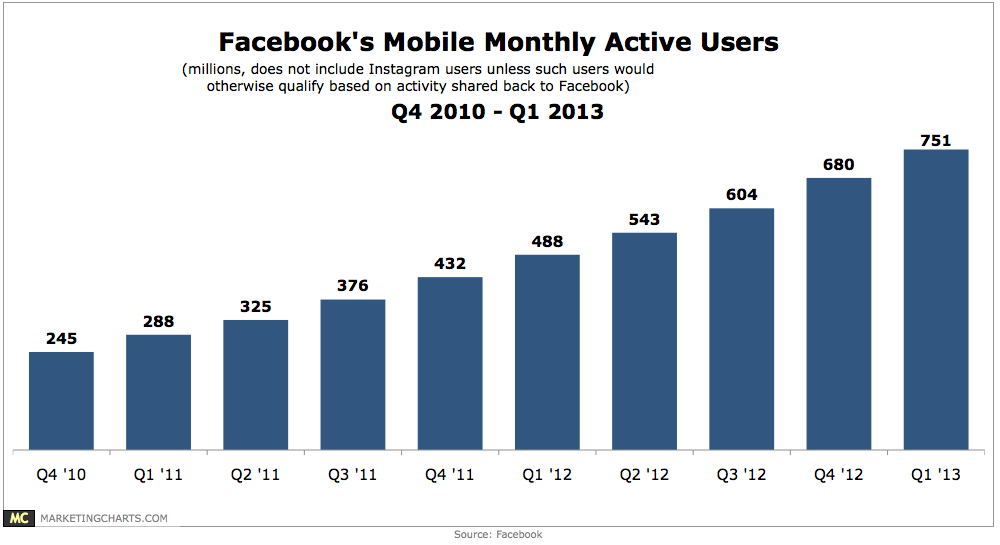
The number of mobile monthly active Facebook users grew by more than 10% quarter-over-quarter, to reach more than three-quarters of total monthly active users worldwide.
Read MoreCPG Mobile Ad Post-Click Actions, 2012 [TABLE]
44% of CPG advertisers implemented video as a post-click campaign action, compared with only 16% of all advertisers.
Read MoreSenior Execs' Use Of Mobile, April 2013 [CHART]
Tablet adoption in particular has jumped, doubling in a year to 6 in 10 respondents, with use growing across all age groups.
Read MoreTime Spent On Mobile Device Online By Activity, Q1 2013 [TABLE]
US mobile internet users spent the greatest percentage of their mobile web time using email, a 23% share of time spent vs. only 5% of time spent on desktop.
Read More
CPG Mobile Advertising Post-Click Actions, 2012 [CHART]
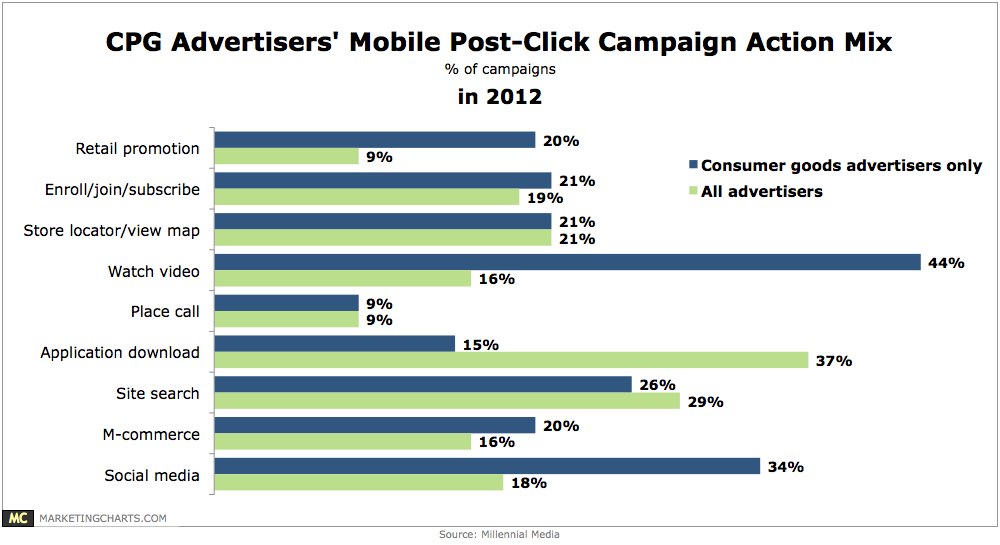
CPG brands were more focused on encouraging consumers to watch video, with 44% of the campaigns incorporating a video aspect (compared to 16% on average).
Read More
Second Screen TV-Related Behavior, April 2013 [CHART]
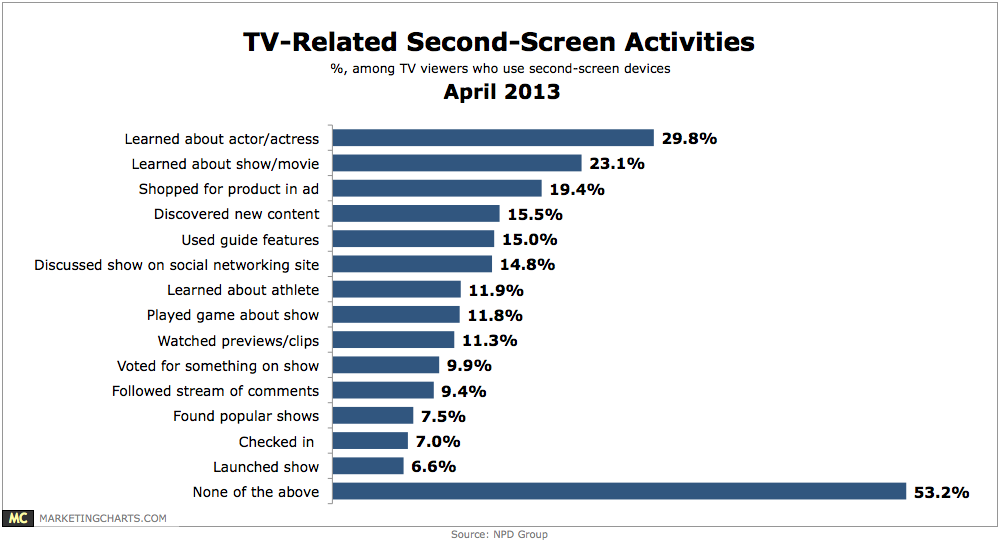
Among the most common is shopping for a product seen in an ad, by 19.4% of TV watchers who engage in second-screen activities.
Read More