Posts Tagged ‘Mobile Social’
Restaurant Mobile Advertising Tactics, Q1 2013 [CHART]
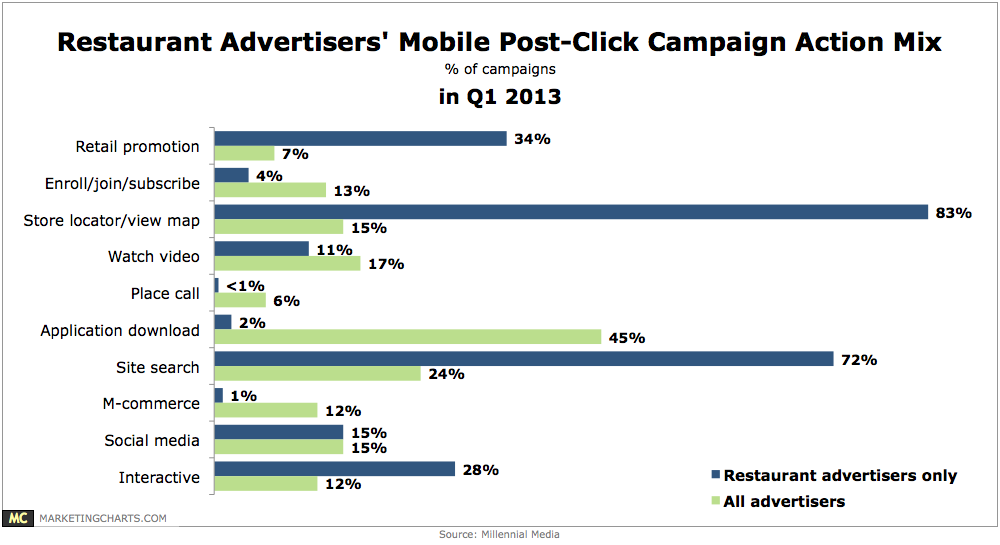
Restaurants’ mobile advertising campaigns are overwhelmingly focused on driving foot traffic, reveals Millennial Media.
Read MoreCollege Students' Multitainment Activities, February 2013 [CHART]
The most popular activity students engaged in while watching TV was using Facebook or Twitter, at 63% of respondents.
Read MoreDead Google Products [INFOGRAPHIC]
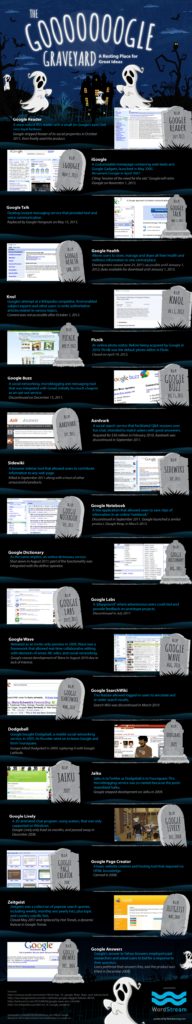
This infographic from Wordstream (via Mashable) notes Google Reader’s passing with a trip through the Google products graveyard.
Read MoreGlobal Facebook Ad Performance Metrics By Type, March 2013 [TABLE]
The sponsored check-in story achieved the highest clickthrough rate (CTR) by a significant margin.
Read MoreUS Twitter Net Ad Revenues, 2011-2015 [CHART]
As of 2012, eMarketer estimates, 52% of Twitter’s net US ad revenues were from mobile; by 2015, the share will approach two-thirds.
Read MoreUS Facebook Net Ad Revenues, 2011-2015 [CHART]
eMarketer estimates that after less than a full year selling mobile ads, 18% of US net Facebook ad revenues came from mobile in 2012.
Read MoreDevices Used To Visit Social Media Sites By Gender, March 2013 [CHART]
The desktop and laptop remained the No. 1 place where users accessed sites, but the smart phone wasn’t far behind.
Read MoreSmart Phone Activity Share By OS, May 2013 [CHART]
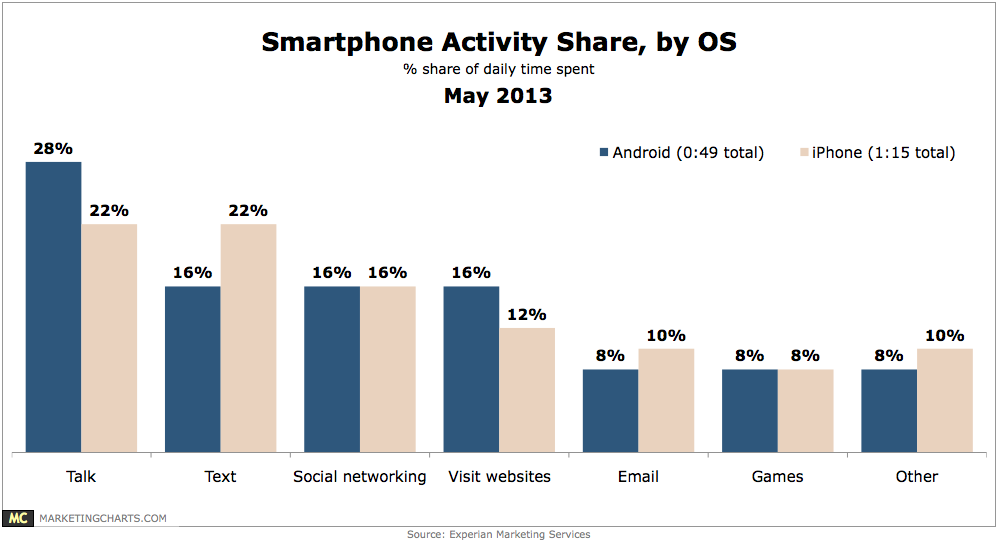
Americans spend about an hour each day on their smart phones (58 minutes to be exact).
Read MoreMobile Video Discovery Methods, May 2013 [CHART]
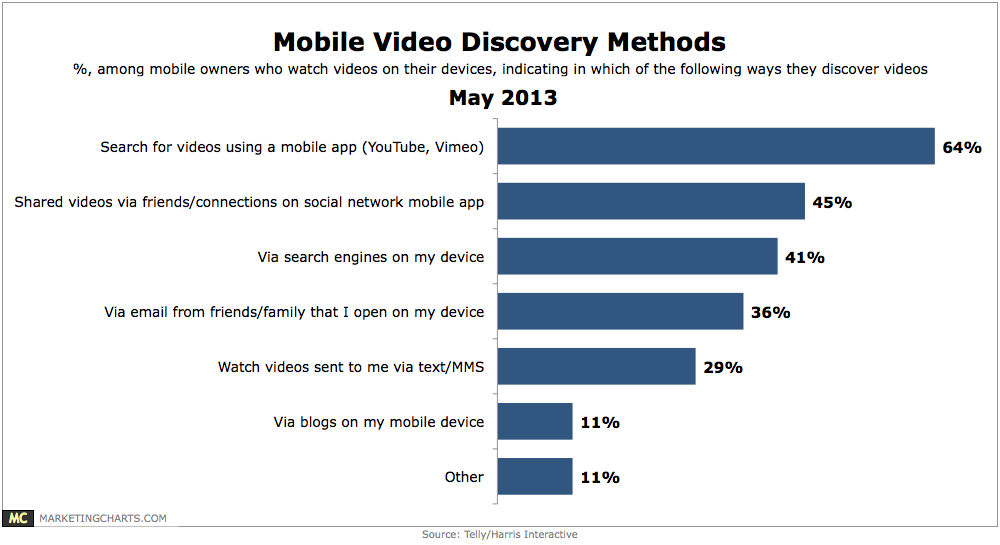
35% of mobile device owners watch videos on their device.
Read MoreInstagram Adoption By Brands, May 1 – February 1, 2013 [CHART]
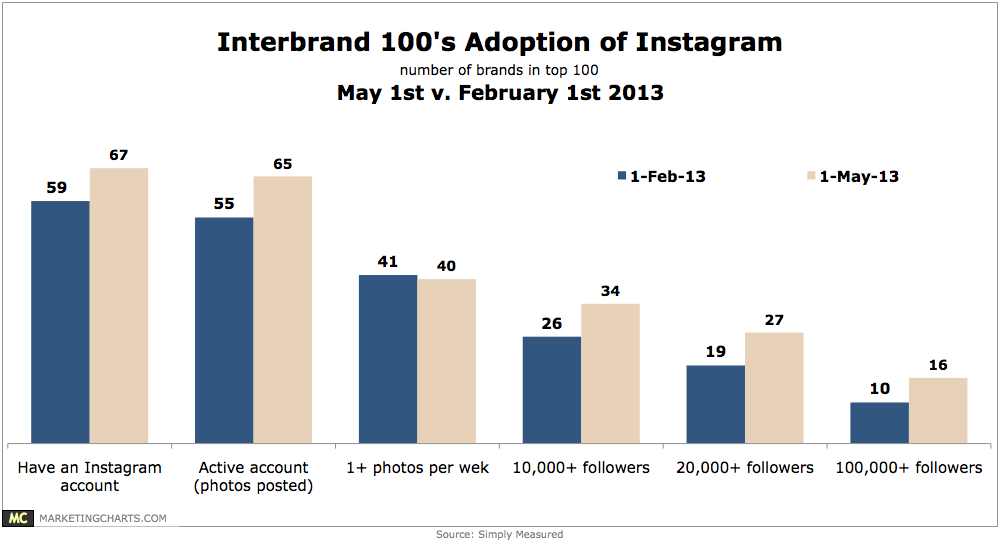
The number of Interbrand 100 brands with an Instagram account has grown to 67 as of May 1st.
Read More