Posts Tagged ‘Mobile Social’
Net US Mobile Ad Revenue Share By Company, 2012-2015 [TABLE]
Google and Facebook grabbed the greatest shares of net US mobile ad revenues, with Facebook jumping from 9.0% to 16.0% between 2012 and 2013.
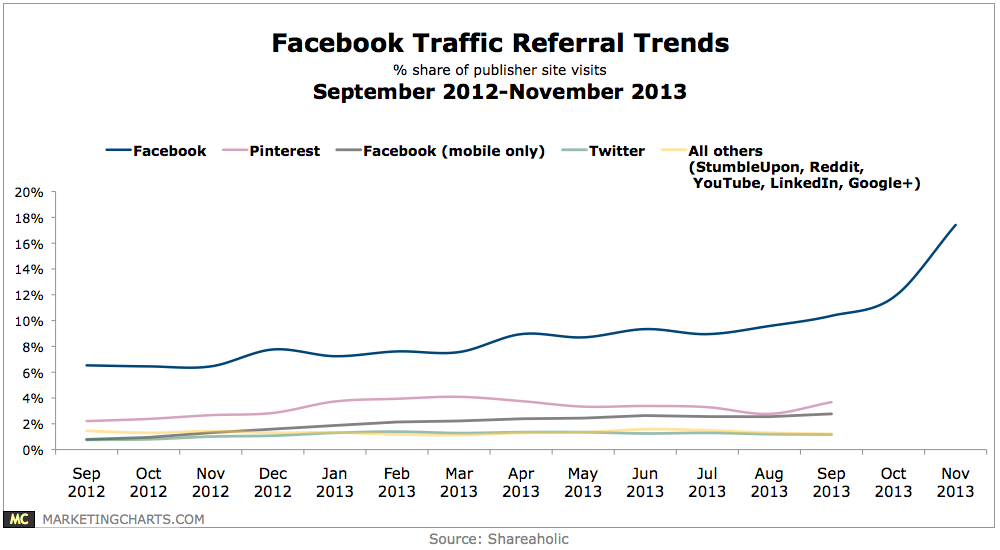
Read MoreFacebook Traffic Referral Trends, September 2012 – November 2013 [CHART]
More than 1 in 6 visits to the average publisher came from a Facebook referral.
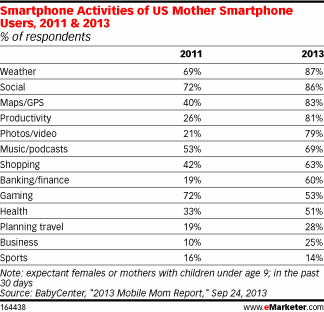
Read MoreUS Mothers' Smart Phone Activities, 2011 & 2013 [TABLE]
Escapism (39%), social (23%), and shopping (12%) were the most popular functions among mothers glued to their mobiles.
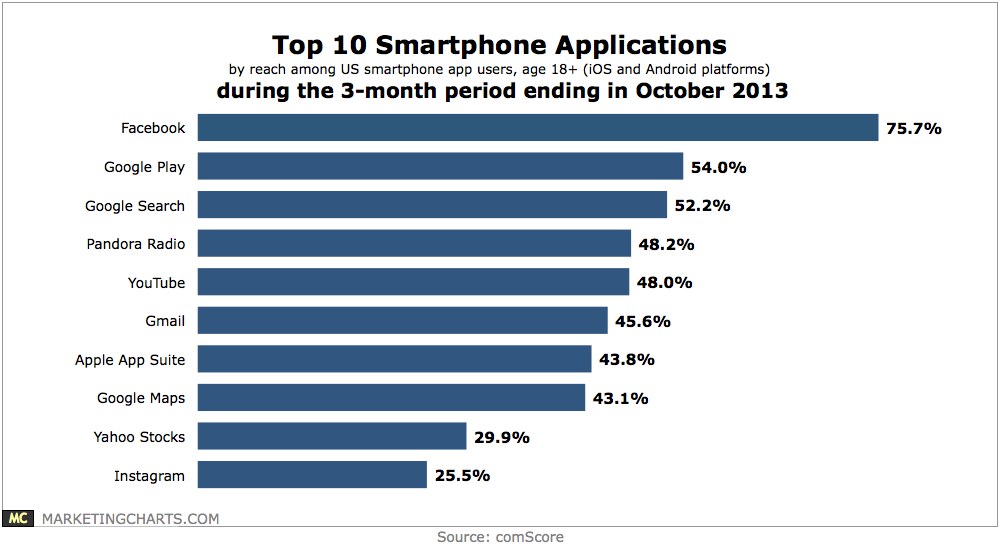
Read MoreTop 10 Smart Phone Apps, October 2013 [CHART]
With 25.5% reach among adult iOS and Android app users, Instagram ranked as the 10th-largest smartphone application during the 3-month period ending in October 2013.
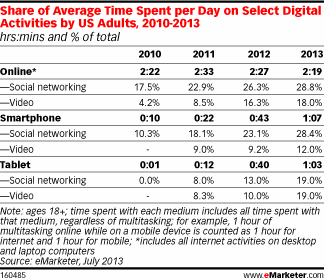
Read MoreShare Of Average Time Spent Per Day On Select Online Activities, 2010-2013 [TABLE]
Fragmented multiscreen media consumption has left marketers struggling to keep up or get a word in edgewise.
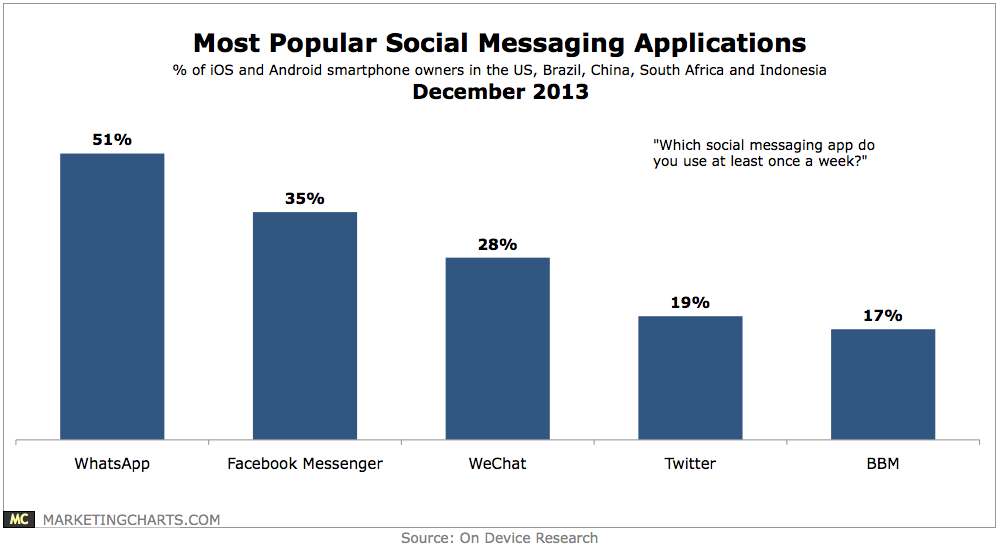
Read MoreMost Popular Social Messaging Apps, December 2013 [CHART]
Smartphone owners across 5 markets – the US, Brazil, China, South Africa and Indonesia – are more likely to be using social messaging applications on a daily basis than making voice calls, sending texts and emailing.
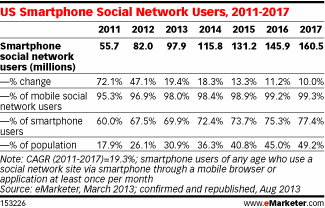
Read MoreAmerican Smart Phone Social Network Users, 2011-2017 [TABLE]
Nearly 100 million US internet users will log on to social networking sites via smartphones at least once per month this year.
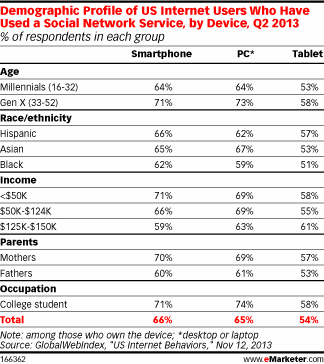
Read MoreAmerican Social Network User Demographics By Device, Q2 2013 [TABLE]
Among millennials, rates of smart phone and PC usage of social networks were identical.
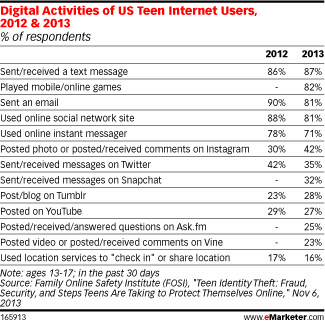
Read MoreOnline Activities Of US Teens, 2012 & 2013 [TABLE]
Fully 87% of American teens said they had sent or received a text message.
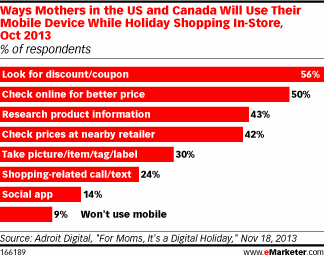
Read MoreHow Mothers Will Use Mobile While Holiday Shopping In-Store, October 2013 [CHART]
25% of mothers polled expected to use mobile devices at least half of the time they were shopping at a physical store location during the holiday season.
Read More
