Posts Tagged ‘Mobile Social’
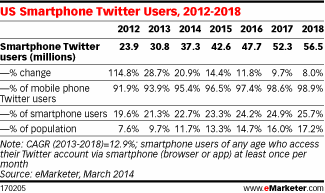
US Smart Phone Twitter Users, 2012-2018 [TABLE]
eMarketer estimates that 43.2 million US consumers used Twitter monthly last year—or 17.6% of the total internet user population.
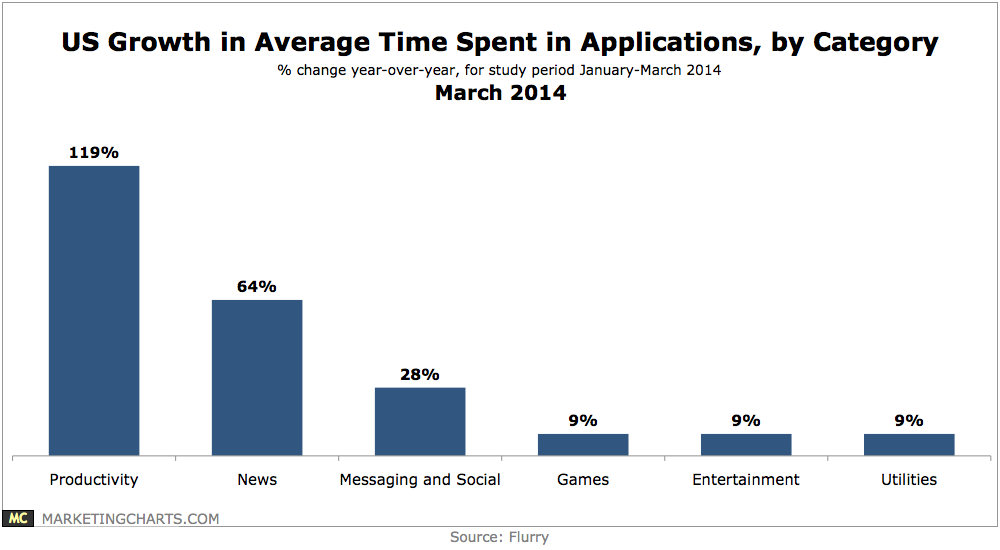
Read MoreGrowth In US Average Time Spent Using Apps By Category, March 2014 [CHART]
Average time spent in productivity apps is growing rapidly, but from a small base: the average US consumer spent 5 1/2 minutes per day in productivity apps during the Q1 study period.
Read MoreTop 5 Twitter Activities Among Mobile Eurpoean Users By Select Countries, November 2013 [TABLE]
Reading posts was the No. 1 mobile Twitter activity in the UK by a long shot, cited by 58% of respondents.
Read MoreEuropean Mobile Twitter Users By Select Countries, November 2013 [CHART]
Eight in 10 UK Twitter users accessed the social network on mobile devices.
Read MoreMobile-Only Audiences For Top Online Sites, February 2013-January 2014 [CHART]
Mobile-only visitor counts to leading publishers are growing rapidly, belying the notion that consumers are accessing content from both desktops and mobiles.
Read MoreNew Mobile Ad Revenue Share Worldwide By Company, 2012-2014 [TABLE]
Google still owns a plurality of the mobile advertising market worldwide, taking a portion of nearly 50% in 2013.
Read MoreUK Youth Mobile Behaviour, January 2014 [TABLE]
75% of UK child and teen tablet users employed their device in order to learn things.
Read MoreCollege Students' Snapchat Use [INFOGRAPHIC]
The majority of pictures sent through Snapchat by college students are selfies.
Read MoreDaily Mobile Activities, February 2014 [CHART]
Smart phone owners spend a whopping 3.3 hours per day on their phones, while tablet owners are close behind, averaging 3.1 hours a day on their devices.
Read MoreWhatsapp [INFOGRAPHIC]
This infographic by Woodpeck3r illustrates the path Whatsapp took to its acquisition by Facebook.
Read More
