Posts Tagged ‘Mobile Gaming’
Senior Execs' Use Of Mobile, April 2013 [CHART]
Tablet adoption in particular has jumped, doubling in a year to 6 in 10 respondents, with use growing across all age groups.
Read MoreSecond Screen TV-Related Behavior, April 2013 [CHART]
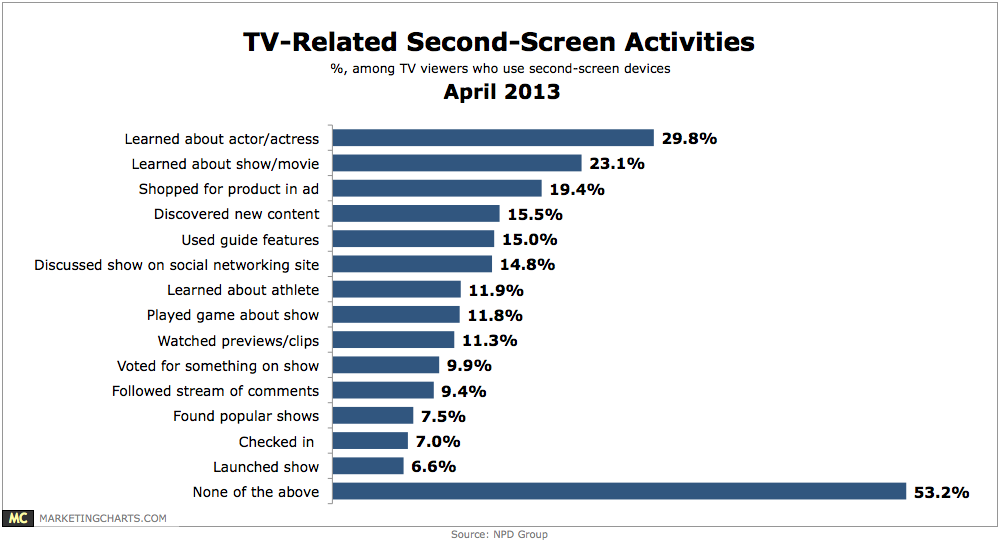
Among the most common is shopping for a product seen in an ad, by 19.4% of TV watchers who engage in second-screen activities.
Read MoreDevices Use For Multitainment, 2012 vs 2013 [CHART]
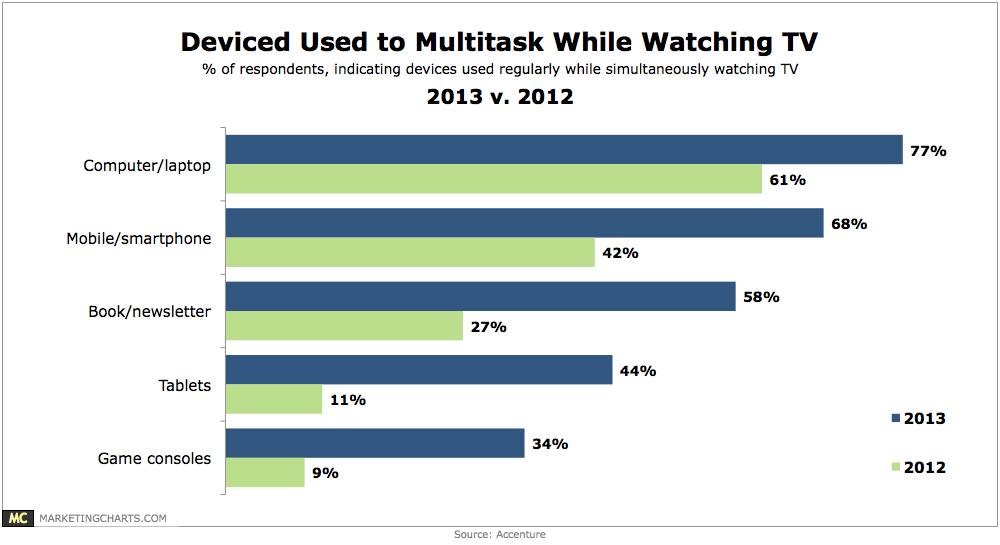
Regular use of tablets while watching TV (on a TV set) has soared from 11% in 2012 to 44% this year.
Read MoreTime Spent On iOS & Android Devices By Activity, April 2013 [CHART]
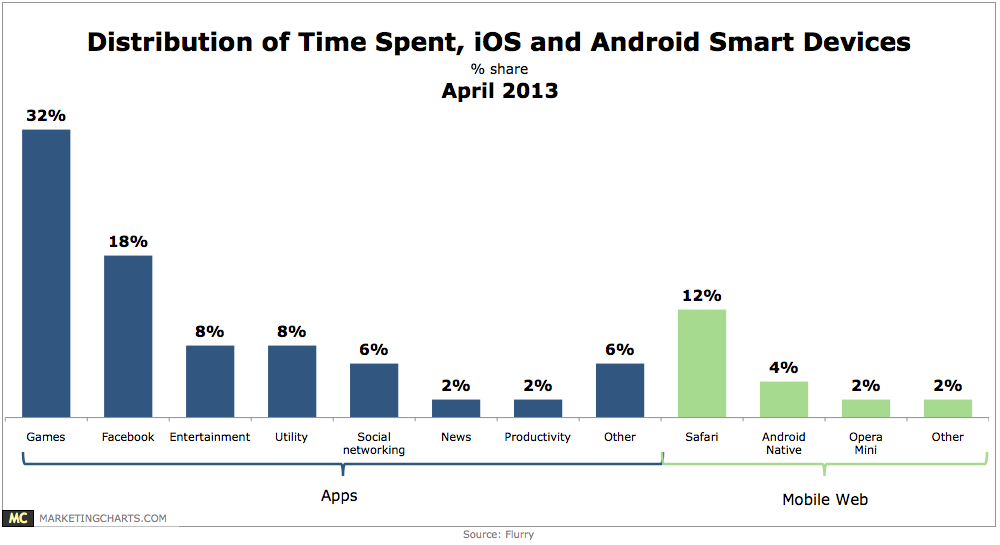
Android and iOS smart phone and tablet users spend an average of 2 hours and 38 minutes per day on their devices.
Read More
Activities Performed On Computers vs. Tablets vs. Smart Phones [CHART]
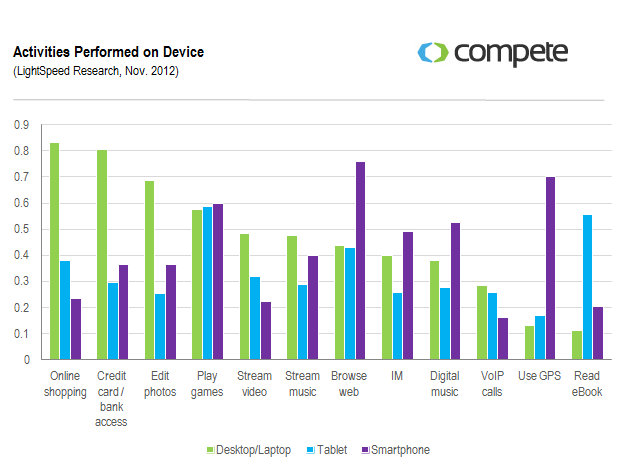
45% of consumers who use their mobile devices to shop report using the device to compare prices.
Read MoreAmerican Mobile, Social & Casual Gamers, 2010-2014 [CHART]
Social games are reaching a level of maturity, and therefore the numbers for monthly unique users are falling.
Read MoreUS Digital Game Revenues, January 2012 & January 2013 [CHART]
SuperData pegged the digital games market at $960 million at the beginning of this year, up from $691 million in January 2012.
Read MoreCollege Students' Top Mobile Activities, November 2012 [CHART]
When asked to name their most frequent mobile activity, other than talking or texting, fully 25% of college students cited accessing Facebook.
Read More