Posts Tagged ‘Mobile Gaming’
Mobile Gaming Metrics Of Android & iPhone Users, December 2012 [TABLE]
iPhone users were 10 percentage points more likely than Android users to be gamers.
Read MoreAdvertising Click-Through Rate Benchmarks, March 2013 [CHART]
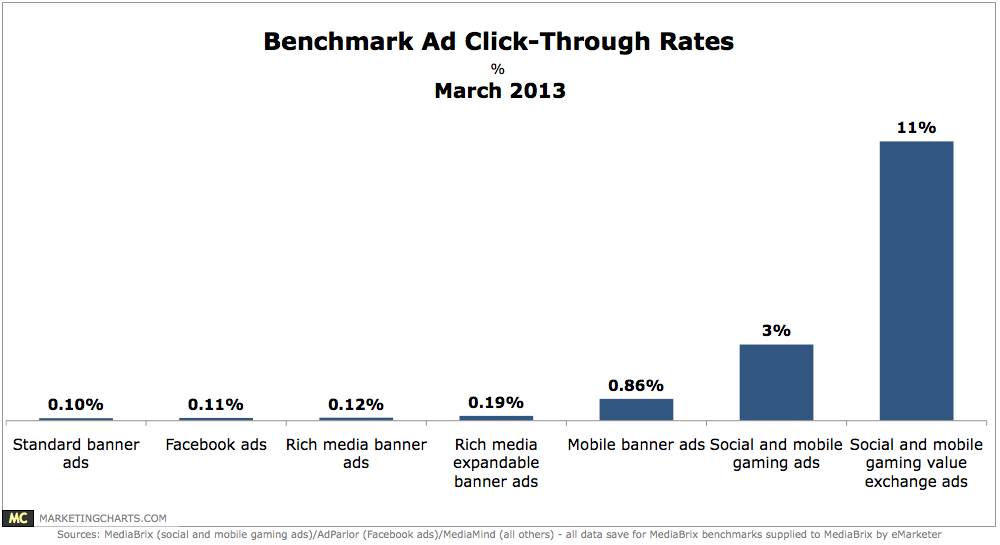
Social and mobile gaming ads generate an average click-through rate (CTR) of 3%.
Read MoreTime Spent On Mobile vs. PC By Website Type, April 2013 [CHART]

This graphic from comScore illustrates time spent on the Internet using a PC vs. mobile.
Read MoreMobile OS Market Share, Q3 2012 [CHART]

64% of mobile game impressions came from devices running the Android OS in Q3, while 30% came from iOS.
Read MorePlanned Consumer Electronics Purchases [CHART]
The poll found that four devices topped the list of consumer electronics that respondents planned to purchase over the next 12 months—smart phones, PCs, HDTVs and tablets.
Read More
Time Spent On PCs vs Smart Phones By Content Type, July 2012 [CHART]

eMarketer estimates that 1.7 billion people around the world will access the internet via a mobile device in 2013.
Read MoreHow Mobile Owners Plan To Use Their Devices In 2013 [CHART]
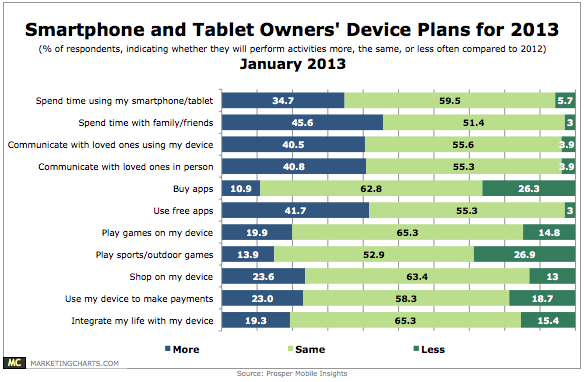
34.7% of mobile users said they would spend more time this year with their devices, compared to just 5.7% who said they would tone it down a little.
Read MoreSocial & Casual Games In 2012 [INFOGRAPHIC]
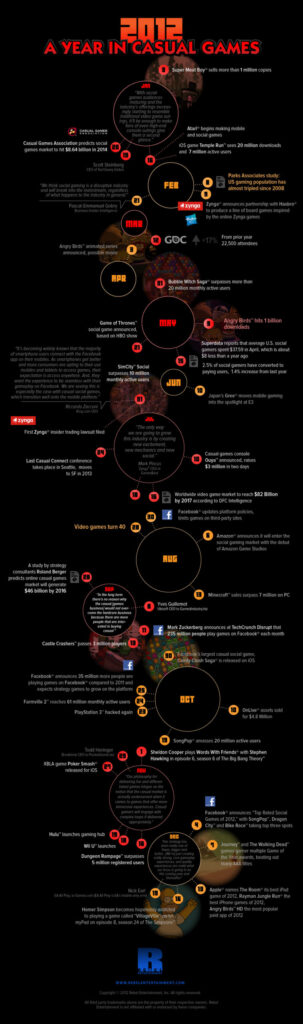
This infographic by Rebel Entertainment shows how social games left their mark in 2012.
Read More