Posts Tagged ‘Mobile Apps’
App Store Competitive Index, June 2012 – January 2013 [CHART]
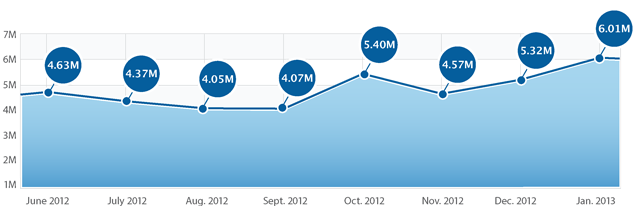
The App Store Competitive Index continued to climb by 6.01 million daily downloads, up 13 percent from December’s 5.32 million.
Read MoreMobile Enterprise [INFOGRAPHIC]
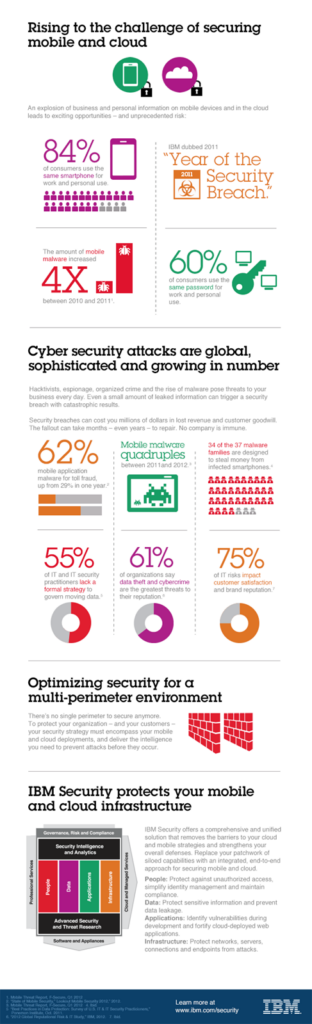
While 84% of consumers now use their personal smart phones for work, mobile malware has increased more than four times since 2010.
Read MoreTop Brand Instagram Adoption [STUDY]
With 90 million monthly active users, 40 million photos per day, and 8,500 likes per second, Instagram has now managed to attract 59% of the world’s top brands.
Read MoreHow Mobile Affects Local Marketing Mix [CHART]
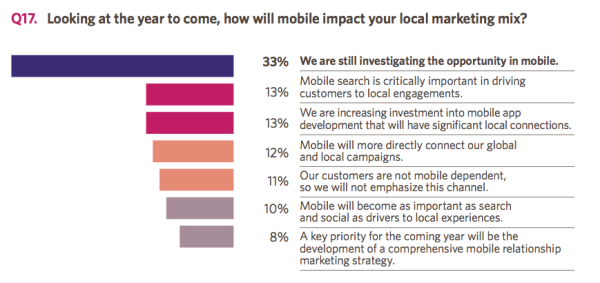
While many brands and retailers have a vague understanding of the importance of localizing their marketing efforts, they simply aren’t doing it effectively — if at all.
Read MoreSunrise: A Social Calendar Mobile App [VIDEO]
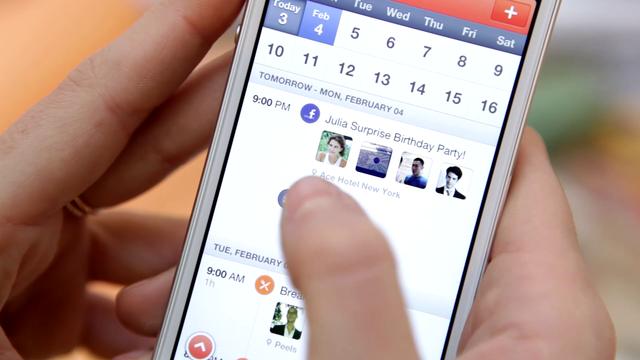
Sunrise started as a web app that pulls in events from Facebook, Google Calendar, EventBrite & LinkedIn & delivers them as a daily email digest every morning.
Read MoreMultichannel Shoppers' Purchase Paths, February 2013 [CHART]
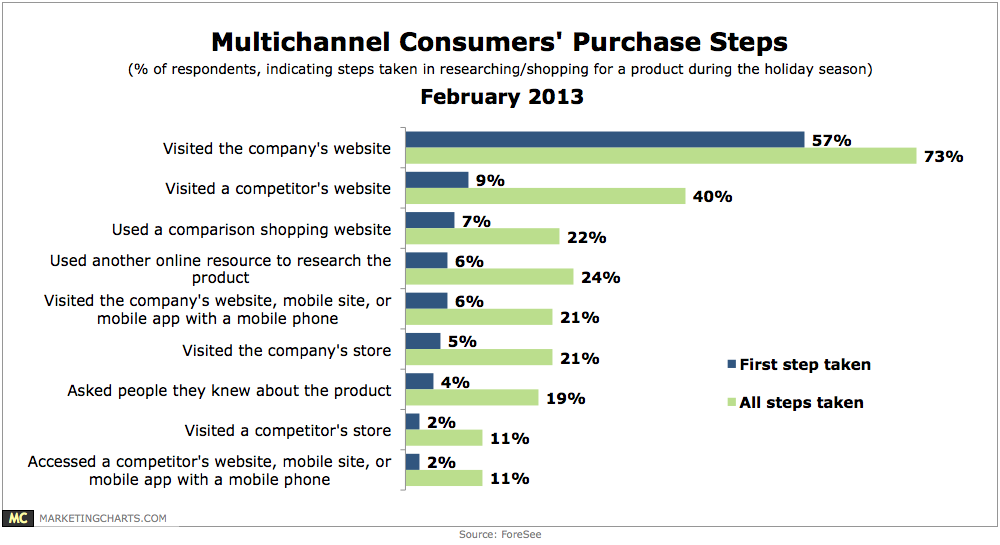
When asked the first step they took in researching and/or shopping for a product this past holiday season, just 6% of multichannel shoppers visited the company’s website, mobile site, or mobile application. But, 21% ended up visiting a company website or app using their mobile phone at some point during the purchase journey, equal to the proportion who visited the company’s store.
Read MoreAmerican Small Business Marketing Budget Allocation By Tactic, November 2012 [CHART]
Small businesses in particular seem to rely on content marketing because it can be extremely cost effective.
Read MoreTech Startup Success & Failure [INFOGRAPHIC]

90% of technology startups fail. This inforgraphic from Allmand Law looks at the successes and failures of well-known tech startups.
Read MoreTop Mobile App Types For Data Consumption, September-December 2012 [CHART]
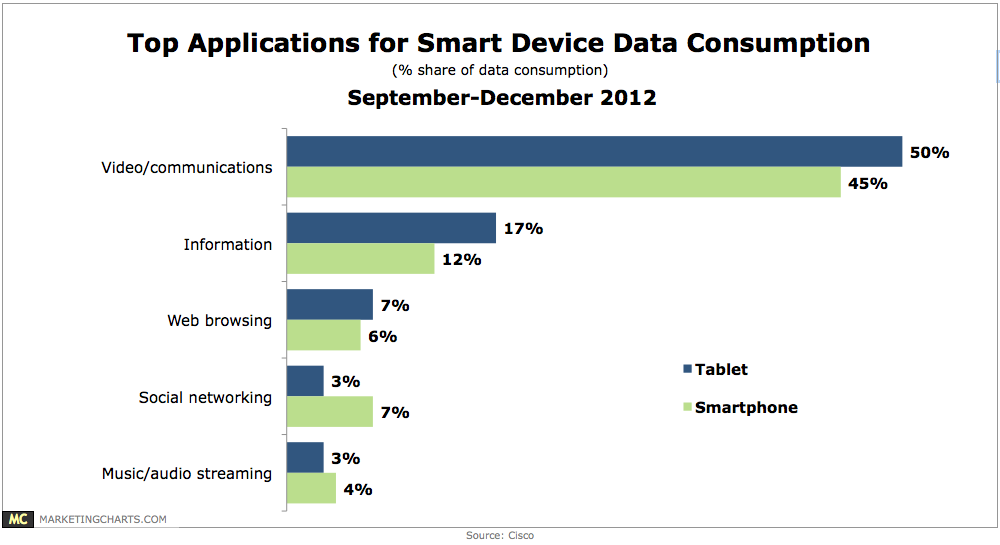
Video streaming and communications applications such as YouTube, Hulu, and Netflix accounted for exactly half of data consumption on tablets, and 45% on smartphones.
Read MoreSocial TV & Super Bowl XLVII [INFOGRAPHIC]

This infographic by Trendrr TV breaks down the social TV chatter that Super Bowl XLVII generated.
Read More